Tag: gfk

  • Asian smartphone sales still lead world

    Asian smartphone sales still lead world

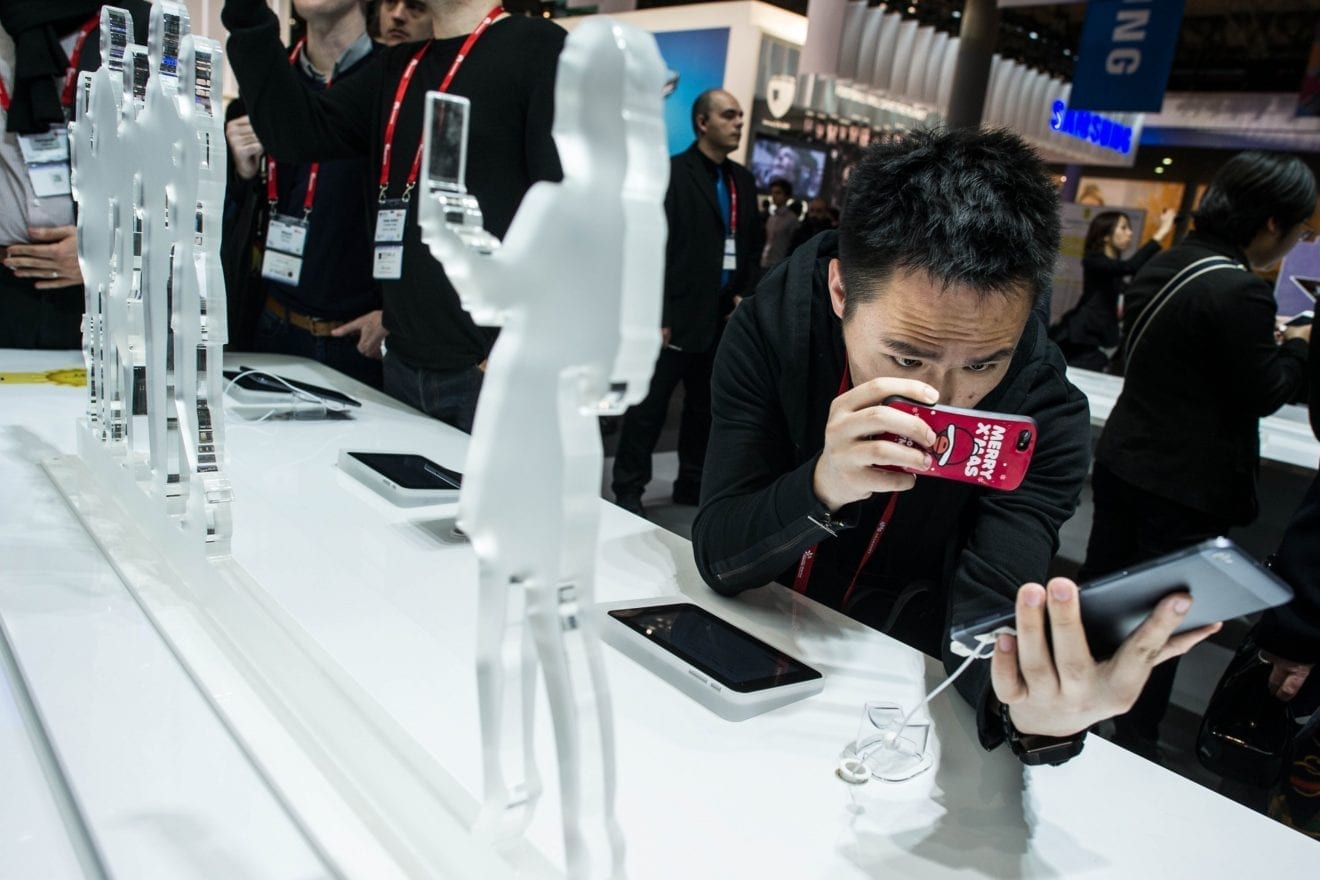
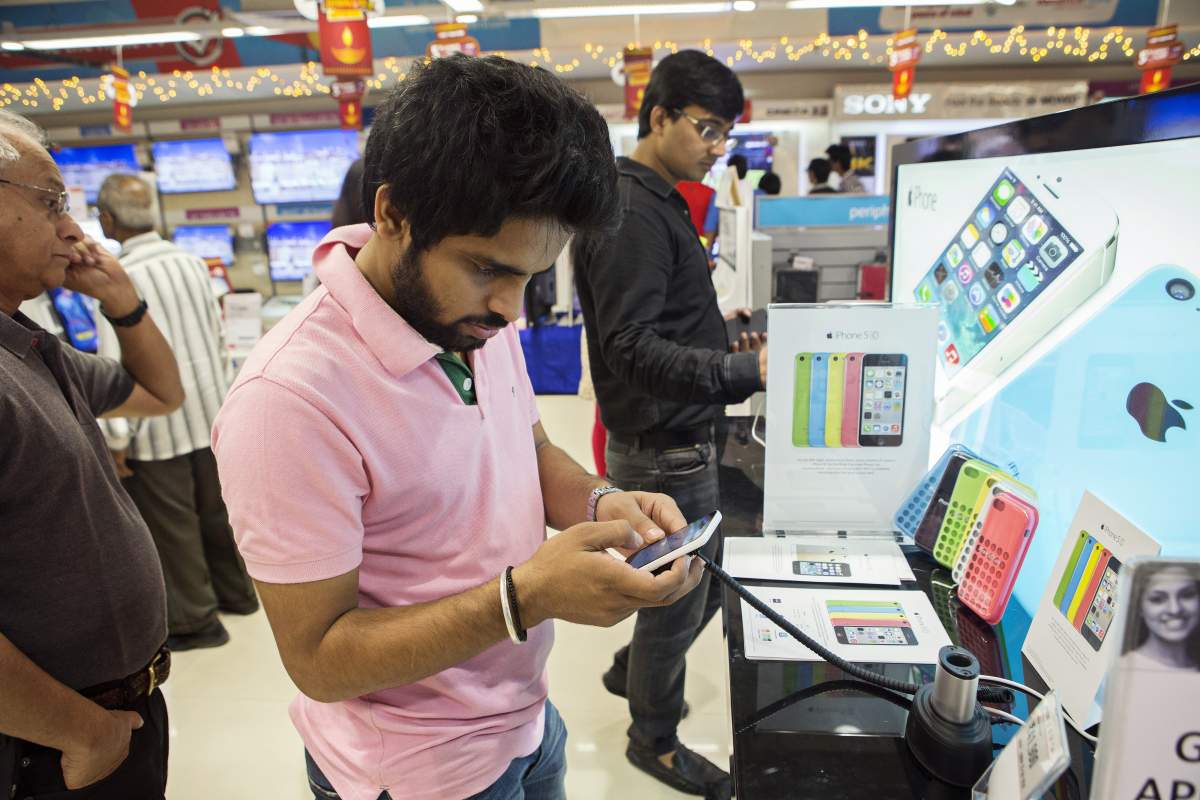
    Asian smartphone sales still lead the world market, with Asia Pacific tipped to remain the fastest-growing region this year.

    Handsets are the main consumer electronic product bought both online and in stores across the region, according to a new study by market research company GFK.

    The study shows 85 per cent of consumers polled across Asia Pacific have bought a consumer electronic item in the past 12 months, half of these purchases made over the internet. Across the 10 markets surveyed, a smartphone was the leading purchase.

    India, Vietnam and Indonesia had the highest incidence of smartphone purchases during the period.

    GFK head of retail, APAC, Jake Shepherd, says developing countries in the region have been strong drivers of consumer electronic sales.

    “The huge, yet largely untapped, potential of the eCommerce industry in these markets is growing rapidly with deepening internet penetration and adoption of connected technology.”

    While all product categories report online sales, offline sales still tend to dominate, says the report. For instance, while 69 per cent of Vietnamese consumers bought a consumer electronic product in the past 12 months, only 20 made the purchase online.

    Shepherd says the consumer purchase journey generally involves seeking information to help with making decisions. In APAC, 44 per cent of consumers do online research before buying a smartphone, with most people checking customer review sites and the manufacturer or brand’s website. Talking to family, friends or colleagues ranks next on the list as an influential information source, especially in Hong Kong and Taiwan where one in four consumers say this helps them make their decision.

    Only 19 per cent of consumers make their decisions based on in-store experiences, and Shepherd says it is important for businesses have a good understanding of the entire path to purchase to effectively formulate shopper strategies.

    For the online survey, during February and March, GFK questioned nearly 6500 regular internet users between 18 and 55 years across 10 Asia Pacific countries – Australia, Hong Kong, India, Indonesia, Malaysia, Philippines, Singapore, Taiwan, Thailand and Vietnam.

    GFK has more than 13,000 researchers and market intelligence from more than 100 countries.

  • Asians show greater propensity amongst global consumers in new technology adoption

    Asians show greater propensity amongst global consumers in new technology adoption

    Asians have emerged as the most enthusiastic adopters of new and innovative technology products globally. The latest findings released by GfK from the first of its kind study—the New Tech Adoption Index (NTAI)1, highlights Asia’s prominence in driving global new technology advancement; with the region’s high demand fueling growth of overall product category in majority of the region’s market by at least 35 percent in both volume and value terms in the past year.

    GfK unveiled detailed findings of their first ever study conducted around the New Tech Adoption Index, which provides a relative measure of the inclination by Asian consumers towards adopting technology and consumer products with advanced features or technology.

    The NTAI leverages GfK’s proprietary point-of-sales data to specifically analyze new consumer technology take-up across over 250,000 products in the consumer durables and technology industry across nine Asian and six key European markets. New consumer technology products categorized into four main baskets2 —Fun, Comfort, Freedomand Essential are analyzed accordingly, including hardware items and those with software-led features such as Ultra HD/4K and Gaming (Fun), Smart Appliances (Comfort), True Wireless, Wearables and AI Speaker (Freedom) and Screen sized larger than 5.5” for Smart + Mobile Phones (Essential)

    “To be competitive, more and more brands are introducing products with innovative features or functionality. In order to succeed in their innovation efforts, it is important for brands to understand where they can find their greatest potential of early adopters, who can then create a network effect for their products,” said Vishal Bali, Managing Director for Client Solutions and Innovation, APAC. “The New Tech Adoption Index can help brands identify these markets, and even pinpoint the specific cities and regions within each market.”

    New Technology Adoption: Different Shades of Asia

    GfK reported a wide ranging spectrum of NTAI between 46 and 146 for the nine Asian markets, highlighting the vast differing levels of new technology adoption in the region.While showcasing the rise of key markets in new tech adoption, it also reveals the fact that the region is home to some of the laggards in this area. The top three markets with the highest overall NTAIs are China (146), Singapore (134) and South Korea (128), while India (46) and Indonesia (67) took their positions at the opposite end of the scale.

    “The New Tech Adoption Index indicates a market’s propensity in new technology adoption based on how much higher or lower their calculated index is positioned from the baseline of 100. We see an obvious trend of market clustering among the developed and developing markets, whereby NTAIs are higher for the more mature markets, and lower for emerging ones,” observed Bali.

    A deeper dive into the Asia’s NTAI reveals that 24 of the total 70 cities evaluated in the study showed above average readings, with the 8 top cities all hailing from China (NTAI range:161-196) —led by Beijing (196) and Shanghai (193). Eight of Korea key cities followed next (NTAI range: 147-156) with Seoul (156), Chungcheong (156) and Inchon (153) showing the highest new tech adoption propensity within this market. Most diverse market within Asia is Indonesia ranging from 33 to 118 with Botabek being the city which sees the highest level of new tech adoption.

    Composition of the index analyzed by the four baskets reveals significant variations from country to country. Asia is clearly a “mobile first” region, which is why the Essentialcategory is the main driver of NTAI across the region. Unique market traits take center stage when it comes to adoption of new tech products for the other categories. For instance, NTAI for the Freedom category is led by Vietnam where the local populations are generally younger, while the mature markets of Korea, China and Singapore exhibit higher NTAIs for the Fun category due to their greater spending power. It is interesting to note that new technology adoption in Comfort category is only significant within Developed Asia.

    New Technology Adoption Index: Asia versus Europe

    GfK also did a comparison of new technology adoption trends between East (Asia) and West (Europe). Amongst the six European markets, the four which have indices reflecting higher propensity in new tech adoption are Great Britain, Spain, Italy and Germany, although their ranking still lag behind four of Asia’s markets. In addition, the gap between the highest and lowest NTAIs is much narrower, in comparison, for European countries—ranging from 80 to 111.

    Another notable difference between the two regions is the higher share of Fun, Freedom and Essential categories existing in the European region, whereas Comfort is practically a nonexistent category here.

    Bali added, “The wide variation of new tech adoption in Asia as compared to Europe continues to lend credence to the notion that there is no one Asia, but it is in fact a complex fabric of distinct countries. And the complexity deepens when we consider sub-national characteristics.”

    Implication for Brands in Asia

    GfK’s NTAI study also highlighted the distinct traits of Asian consumers that set them apart from the rest of the world. For instance, evidence from various GfK reports reveal that Asian shoppers tend to be less loyal, more experimental, and are growing in sophistication when it comes to making purchase decisions thereby making the markets in Asia an ideal haven for new product test marketing.

    GfK Asia’s NTAI offers a view on the market’s receptivity to new consumer technology products and help businesses make crucial decisions pertaining not just to market selections to launch innovative new products, but also provide valuable market intelligence that can help brands in their product conceptualization process to ensure that the new tech product features will go down well with their target market.”

    According to findings from another GfK study, nearly two in every three (64%) respondents surveyed in Asia said that they are less loyal to any one brand—a seven percentage point jump from two years ago. In comparison, the proportion of respondents in US and Europe who shared the same sentiments were significantly lower.

    “However, a one-size-fits-all strategy will not work for Asia’s highly diversified and fragmented marketplace,” emphasized Bali. “Instead, focusing on pivotal factors such as perfecting their distribution and pricing strategies across different cities and channels, and gaining a good grasp of their different consumers’ needs and adoption behaviors, will significantly up the success rate of new technology brands in the consumer tech and durable space.”
  • Huawei retail plans 15,000 new stores

    Huawei retail plans 15,000 new stores

    Smartphone maker Huawei plans to open 15,000 retail stores internationally this year in a bid for a record-high shipment of smartphones and greater sales of premium-priced models.

    “We are optimistic and confident about reaching our target shipment of 140 million smartphones this year,” says its business group CEO Richard Yu Chengdong. That would mark a 30 per cent increase in smartphone shipments from 108 million units last year.

    Yu says the Huawei retail store expansion would help drive sales of its high-end smartphones in the US$500 to US$600 range.

    Huawei’s retail arm had 35,000 of its own stores around the world at the end of May, up 116 per cent year on year. It has 11,000 stores in mainland China, 6500 stores across the rest of Asia, 6200 in Europe and 1500 in South America. This compares with Apple’s 484 retail outlets in fewer than 20 countries.

    Huawai  is represented in more than 170 countries and territories, supported by a growing number of third-party shops. These include outlets in shopping malls and stores owned by mobile network operators like China Mobile.

    Its smartphone shipments grew 25 per cent year on year to 60.56 million units in the first six months of this year. Sales generated by the company’s consumer business group in the first half jumped 41 per cent to 77.4 billion yuan (US$11.6 billion), with more than half from overseas markets.

    Data from market research firm GFK shows that Huawei’s share of the global smartphone market reached 11.4 per cent at the end of May. Its share of the premium smartphone market was 25.7 per cent, up from 15.2 per cent at the end of March.

    The Shenzhen-based firm, which also sells network equipment to telecommunications service providers and other enterprises, reported this week that its total revenue in the first half of this year jumped 40 per cent to 245.5 billion yuan, up from 175.9 billion yuan for the same period last year.

  • Where Chinese tourists are spending their shopping dollar

    Where Chinese tourists are spending their shopping dollar

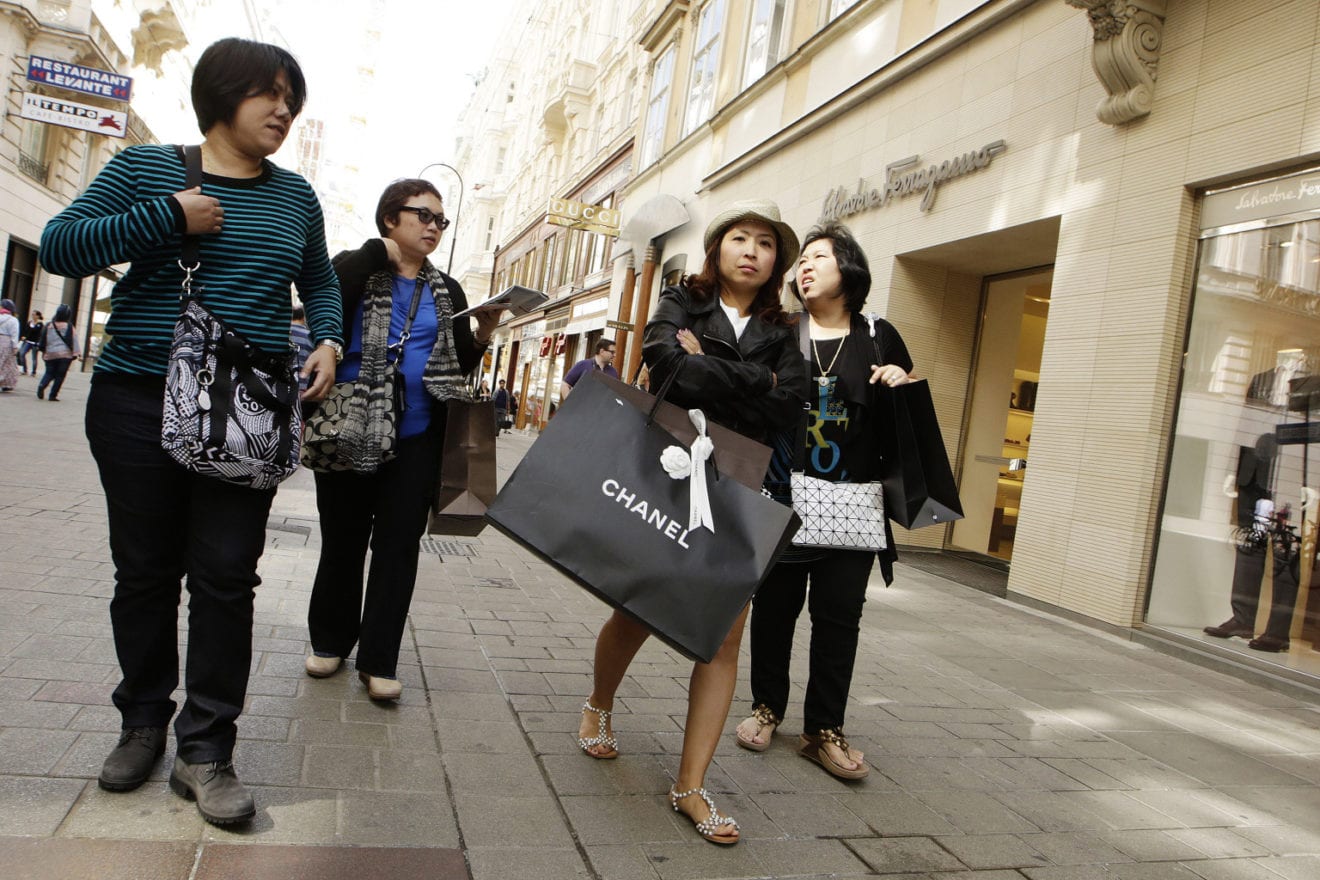
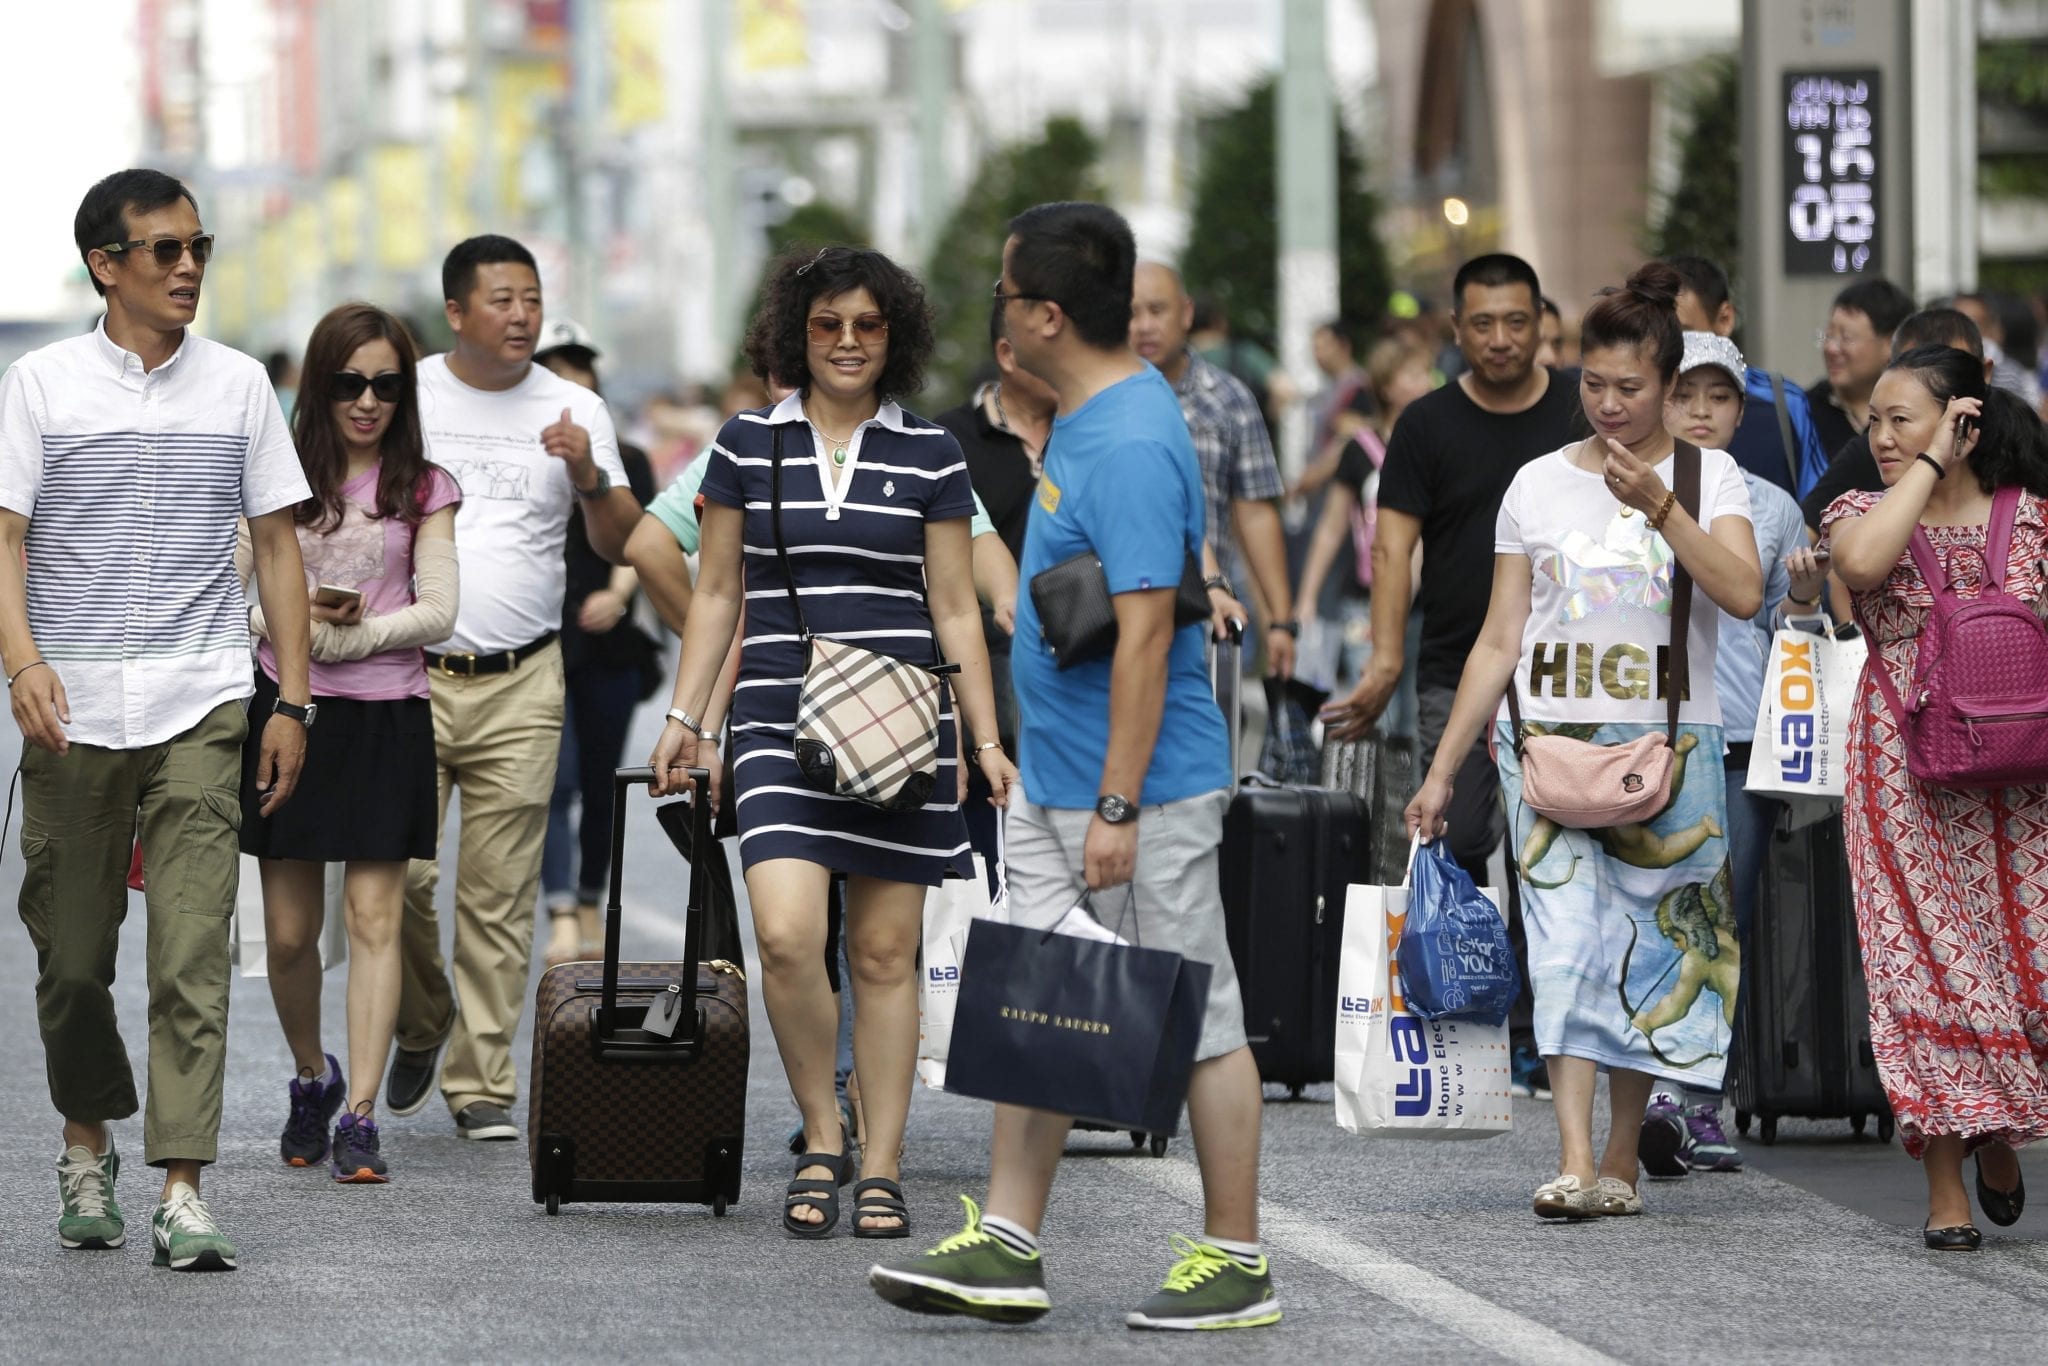
    Mainland China has become one of the main global suppliers of tourists, and that has been paying dividends for retailers globally.

    But as the Chinese are roaming further afield, Hong Kong and Macau retails have seen their sales dropping.

    A fresh analysis from international market research company GFK shows China had 109 million outbound tourists last year… and they spent US$229 billion in retail stores. These statistics consolidate China as one of the main global sources of tourists, both in terms of number of trips and money spent while travelling internationally.

    “At the same time, there have been profound changes in the behaviour of the typical Chinese traveller, with millennials firmly established as the core drivers of spending,” says GFK.

    Because of its cultural similarity, accessibility and lower travel costs, Hong Hong was the preferred destination for Chinese tourists up until 2013. Shopping was a big motivation for visiting. However, since 2014, says the report, more Chinese tourists have been opting for other destinations offering historical and cultural experiences – as well as shopping.

    Air travel and accommodation statistics show that at the start of November, the top five favourite destinations for Chinese travellers were South Korea (visits up 112 per cent since 2011), Thailand (up 263 per cent), Japan (up 157 per cent) and Taiwan (up 54 per cent. Surprisingly, given its loss of retail sales, Hong Kong had 37 per cent more Chinese visitors. This is explained by the new emerging middle class – consumers who do not have enough disposable income to travel further abroad, nor to spend on high-end purchases.

    Europe is the most popular destination outside Asia for Chinese tourists, with 97 per cent more visits in the past four years. This is followed by North America (up 151 per cent) and the Middle East (up 177 per cent).

    “China’s tourists remain strategic to Hong Kong and its businesses, as other destinations are jumping ahead in winning their favour,” says GFK global head of travel and hospitality Laurens van den Oever.

  • Vietnam tablet market soars

    Vietnam tablet market soars

    The rapid growth of the Vietnam tablet market is boosting the potential of eCommerce in the fast-maturing Southeast Asian nation.

    New figures from GfK this week show the growing number of lower priced entry level tablets has seen a double digit growth in sales in first five months of this year – or 149,000 extra units – to reach 582,000.

    GfK projects the media tablet market will achieve even higher sales in the third quarter of the year with the anticipated back to school promotions, with annual sales estimated to hit 1.9 million for the year.

    Yet the total amount spent on tablets has fallen by about five per cent, due to the greater contribution of those lower value media tablet models.

    “Over three in every four (76 per cent) media tablets sold so far in 2015 cost less than US$300, as compared to just one in two (50 per cent) in 2014; signifying a strong shift in market trends towards the low-end segment,” observed Tran Khoa Van, MD of GfK in Vietnam.

    “The result of more media tablets being sold at lower prices brought about a shrinkage in the total market value in spite of strong consumer demand for the gadget.”

    On the other hand, high-end media tablets priced above US$500 which accounted for 29 per cent of the total market’s sales volume had reduced by half to make up only 14 per cent share in the first five months of this year. A similar trend is seen in the US$300-500 segment, where its 22 per cent share last year was reduced to 11 per cent in 2015.

    According to GfK findings, the average price of media tablets declined by 30 per cent from US$367 last year to US$259 this year. Although the number of brands catering to the Vietnamese market reduced from 56 to 49, the remaining players have introduced 20 more new models – from 278 to 298.

    Another emerging trend is the rising popularity of smaller screen sized media tablets, specifically the 7.9” and below segment. Over seven in 10 (71 per cent) of media tablets purchased this year were of this size, up from its 62 per cent market share last year.

    On the other hand, it was the 9-10” segment which reported a dwindled market share by half – from 26 to 13 per cent.

    “Price erosion is a natural progression of a tech product’s lifecycle and the average price of media tablets will definitely be drifting down further from the low of US$250 reported in the latest tracked month of May,” said Van.