Tag: consumer spending

  • Australian Retail Health Index Drops to Negative 1.07 as Insolvencies Rise

    Australian Retail Health Index Drops to Negative 1.07 as Insolvencies Rise

    Australian retail conditions worsened sharply in the three months ending June 2026, dragging KPMG’s Retail Health Index down to negative 1.07 from negative 0.37 in the previous quarter.

    A steep 11.4 per cent drop in consumer sentiment drove the decline, even as total household spending and producer prices recorded modest gains.

    Pressures on cash flow and demand led to 254 retail insolvencies during the three-month period. Employers pulled back hiring across store networks, cutting job vacancies by 15.3 per cent to leave 26,000 open roles across the country. The index measures spending, sentiment, turnover, pricing and underlying business performance to gauge sector viability.

    Value Hunting Alters Store Economics

    Shoppers across Australia have shifted their habits toward planned, price-sensitive purchases rather than halting expenditure entirely. Foot traffic and checkout totals increasingly concentrate around major promotional windows such as End of Financial Year sales, thinning margins for operators between events.

    For regional retail groups and brand distributors, this concentration creates sharp operational volatility. Inventory holding costs rise between discount periods, while staffing models must flex quickly to handle brief spikes in transaction volume without blowing out payroll costs.

    Digital Channels and Labour Adjustments

    Suppliers face renegotiations on wholesale terms as storefront operators fight to protect gross margins against higher input costs. Landlords in secondary shopping centres risk longer lease negotiations, particularly where specialty fashion and discretionary merchants struggle to sustain standard rent-to-sales ratios.

    The contraction follows a prolonged period of cautious buying that started when higher borrowing costs began constraining disposable income across major metropolitan centres. Earlier quarters had managed to absorb rising operational overheads through modest price adjustments, but consumer pushback against shelf prices has now limited further retail pass-through.

    Promotional Execution Takes Centre Stage

    Relief for the sector depends heavily on whether lower supply chain disruptions and sustained population growth can offset cautious household budgets. Retailers are directing investment into automated personalisation and inventory tracking systems to lift conversion rates ahead of high-volume seasonal trading.

    Merchant performance across the market now hinges on order execution during the upcoming Black Friday and Cyber Monday discounting calendar.


  • Australian Grocery Baskets Rise 8.5% as Shoppers Trade Down

    Australian Grocery Baskets Rise 8.5% as Shoppers Trade Down

    Australian households face an 8.5 per cent jump in standard grocery costs, pushing four-person families to spend an average of $245 weekly at supermarket checkouts. That identical basket of goods climbed to $232 in July 2026 from $214 in March 2025, according to tracking data from consumer research firm Canstar.

    Overall household grocery spending rose two per cent year on year from an average of $240 per week, held down only because shoppers are actively ditching premium items and buying cheaper alternatives. Research from ANZ Institutional shows consumers are managing higher food costs by swapping beef for chicken, picking private-label staples like pasta and canned tomatoes, and structuring purchases around promotional cycles.

    Trading down to private labels

    Price scrutiny has altered basket composition across major supermarket chains. Canstar survey data indicates 40 per cent of shoppers cut back on discretionary treats and snacks, while 38 per cent spend extra time evaluating unit pricing on shelves. Another 30 per cent target marked-down stock, and 25 per cent now buy supermarket home brands instead of proprietary labels.

    The shift demonstrates how consumer adaptation blunts headline shelf inflation. Families who alter their purchasing baskets shield their weekly budgets, while those maintaining rigid preferences for items like fresh beef, dairy and convenience foods absorb the full weight of cumulative price gains.

    “Food inflation doesn’t just change prices; it changes habits,” said Matthew Mann, director of research and analysis at ANZ Institutional.

    Margin squeeze for national brands

    For packaged goods manufacturers and tier-one food brands, this behavioral pivot threatens market share in key dry-grocery and dairy categories. Major supermarket operators in Australia continue to expand their private-label ranges, securing margin while offering entry-level price points that squeeze branded suppliers off shelf space.

    Suppliers unable to fund trade promotions or justify premium pricing risk permanent volume losses as private-label loyalty solidifies. The margin pressure sits heavily on domestic food processors, who must navigate higher logistical and ingredient costs without full pricing power at the retail negotiating table.

    Tracking the checkout shift

    Cost pressures built steadily through 2025 before escalating into mid-2026, compounded by wider supply chain friction and energy costs. University of Sydney retail researcher Lisa Asher noted that real wage growth has failed to keep pace with cumulative food cost increases over that window.

    The key metric for Australian retail suppliers through the final quarter of 2026 is volume recovery in branded meat and snack categories as promotional discounting deepens.

  • Australian Shoppers Shift to Private Labels as Discretionary Sales Drop

    Australian Shoppers Shift to Private Labels as Discretionary Sales Drop

    Australian supermarket chains lifted private-label grocery sales by up to 6.1 per cent in fiscal 2026 as stubborn inflation squeezed household budgets. Coles Group reported that own-brand revenue outpaced overall company growth, with one in three customer baskets now containing its private-label lines.

    Woolworths Group recorded a 5.5 per cent increase in own and exclusive brand sales over the same period. Budget department store Kmart, operated by Wesfarmers, delivered resilient sales, while rival Big W returned to profitability before early fiscal 2027 trading slowed.

    Private Labels Win Margin and Volume

    Household goods retailers experienced a sharp pullback in consumer demand. Furniture chain Nick Scali reported that customer traffic fell by up to 15 per cent in the quarter to August as residential property turnover slowed. Australian same-store sales at Harvey Norman dropped 3.4 per cent, and electronics chain JB Hi-Fi posted its largest single-day share price decline since 2020 after missing consensus sales estimates.

    Quick-service dining networks faced similar pressure. Retail Food Group, which operates Gloria Jean’s and Donut King, booked an annual decline of roughly 3 per cent in domestic network sales. Automotive parts maker ARB posted a 3.3 per cent drop in Australian aftermarket revenue, while used-car transactions across the country fell 16.2 per cent in June.

    Property Slump Stalls Discretionary Demand

    Consumer price inflation has held above 3 per cent since 2025, outpacing wage growth of 3.2 per cent in the June quarter. With Commerzbank calculating that 60 per cent of Australian household wealth is tied up in residential real estate, higher borrowing costs and property tax adjustments targeting investors have directly curbed big-ticket purchases.

    The divergence across retail categories mirrors trends across Asia-Pacific markets, where food retailers expand low-price private lines to capture defensive trade while durable goods sellers rely on promotional financing to prevent transaction volumes from falling further.

    Trading updates for the first eight weeks of fiscal 2027 show sales at Big W have already started to decline, making the upcoming quarterly retail trade data the next key benchmark for consumer demand.

  • Japan Retail Sales Rise 4.0% in July as Department Stores Beat Formats

    Japan Retail Sales Rise 4.0% in July as Department Stores Beat Formats

    Japan’s retail sales rose 4.0 per cent year on year in July, driven by vehicle demand and strong department store receipts. Data released on August 31 by the Ministry of Economy, Trade and Industry (METI) showed department stores expanded 4.3 per cent, outperforming convenience stores at 1.3 per cent and supermarkets at 0.8 per cent.

    Wholesale sales across the country climbed 9.0 per cent over the same period, pointing to steady business-to-business inventory movement alongside consumer channels.

    Autos and Machinery Lift Totals

    Gains varied sharply by product line. Motor vehicle retail jumped 16.2 per cent year on year, delivering the fastest expansion among all retail sectors tracked by METI. Machinery and equipment retail climbed 6.3 per cent, while general merchandise sales rose 3.1 per cent and medical and cosmetics retail gained 1.6 per cent. Fuel retail turnover remained flat.

    Apparel and textile retail dropped 6.6 per cent year on year. That was the steepest contraction in the survey and the only major retail category to decline in July.

    Department Stores Lean on Inbound Spend

    The gap between falling clothing sales and rising department store receipts reveals a split in consumer behavior. Department store operators historically rely on apparel for a large share of their floor space, yet their revenue expanded while domestic clothing retail contracted. Tax-free transactions, luxury goods, and jewellery purchases by foreign visitors filled the shortfall left by cautious local fashion shoppers.

    Department stores across East and Southeast Asia have navigated similar pressures, leaning into high-margin luxury concessions and tourist footfall to offset sluggish domestic volume in apparel. For Japanese operators, sustained gains now tie closely to exchange-rate levels and international passenger arrivals rather than domestic wage spending.

    METI will publish its finalized July commerce figures in mid-September, with retail watchers monitoring whether vehicle order backlogs and inbound tourist spending hold up through late summer.

  • Japan Household Spending Drops 3.6% in July as Inflation Bites

    Japan Household Spending Drops 3.6% in July as Inflation Bites

    Japanese household spending dropped 3.6 per cent year-on-year in July, falling at its fastest annual pace in 30 months as persistent inflation squeezed family budgets.

    The contraction exceeded the 1.6 per cent drop projected by economists and extended a losing streak that has run for eight straight months. It represents the sharpest annual pullback since January 2024, when outlays tumbled 6.3 per cent. On a seasonally adjusted month-on-month basis, spending ticked up 0.5 per cent, falling far short of the 2.6 per cent gain expected by the market.

    Food and Transport Budgets Shrink

    Data from the internal affairs ministry reveals clear shifts in how shoppers manage everyday expenses. Families cut back sharply on groceries and transportation while directing remaining discretionary yen toward entertainment and select household goods.

    The squeeze shows that higher price tags are eating through recent pay increases across the country. Wage gains secured during spring negotiations have not translated into stronger checkout tallies, leaving merchants to navigate cautious foot traffic and smaller baskets.

    Masato Koike, senior economist at Sompo Institute Plus, noted the challenge facing household balance sheets: “Although large wage hikes were achieved again in this year’s spring wage negotiations, downward pressure on consumption is expected to intensify as higher prices become more pronounced going forward.”

    Rate Hike Scrutiny

    Weak private consumption complicates the immediate policy path for the Bank of Japan, which meets this month to review borrowing costs. Central bank officials are weighing whether the domestic economy can absorb higher interest rates while consumer demand stays sluggish.

    Price pressures continue to build across metropolitan centers. Annual core consumer inflation in Tokyo accelerated for a third consecutive month in August, pointing to persistent living costs that will keep retail spending under pressure heading into the final quarter.

  • South Korea Inflation Hits 3.1% as Telecom Discounts Fade Out

    South Korea Inflation Hits 3.1% as Telecom Discounts Fade Out

    South Korea’s consumer price index rose 3.1 per cent in August, distorted by an end to historical mobile billing discounts, according to the Ministry of Economy and Finance.

    Excluding the sharp rebound in telecommunications charges, consumer inflation ran at an estimated 2.5 per cent for the month. The gap stems directly from base effects created 12 months earlier, when SK Telecom rolled out widespread customer discounts.

    Base Effects and Mobile Charges

    Mobile phone service charges jumped 26.7 per cent in August compared to the same period last year. That spike reflects an abnormal comparison point in August 2025, when SK Telecom halved subscriber bills following a cyber security breach that compromised records for more than 20 million users.

    “In August last year, there was a temporary 50-percent discount in mobile bills, which served as a base effect, leading to a 3.1 percent rise in consumer prices this month,” said Kang Gi-lyong, a senior financial official, during a government meeting in Seoul.

    The return to normal tariff collections across the country’s primary wireless network added 0.6 percentage points directly to the headline inflation reading.

    Energy Caps and Holiday Pressures

    State market interventions also altered headline price dynamics across other consumer categories. South Korea’s active fuel price cap trimmed an estimated 0.5 percentage points off total consumer price growth, keeping the August index below an unmitigated 3.6 per cent.

    For consumer brands and retailers, the underlying 2.5 per cent rate reflects a clearer picture of domestic demand than the headline figure suggests. Household purchasing power across major metropolitan areas remains tight, but spending on staples and discretionary services has stabilized as core price growth cools.

    Government economic planners expect overall consumer price pressures to moderate further during September. Officials are preparing support packages to keep food and household goods prices stable ahead of the Chuseok holiday shopping period.

  • Philippines to Drop VAT on Power System Loss Charges by November

    Philippines to Drop VAT on Power System Loss Charges by November

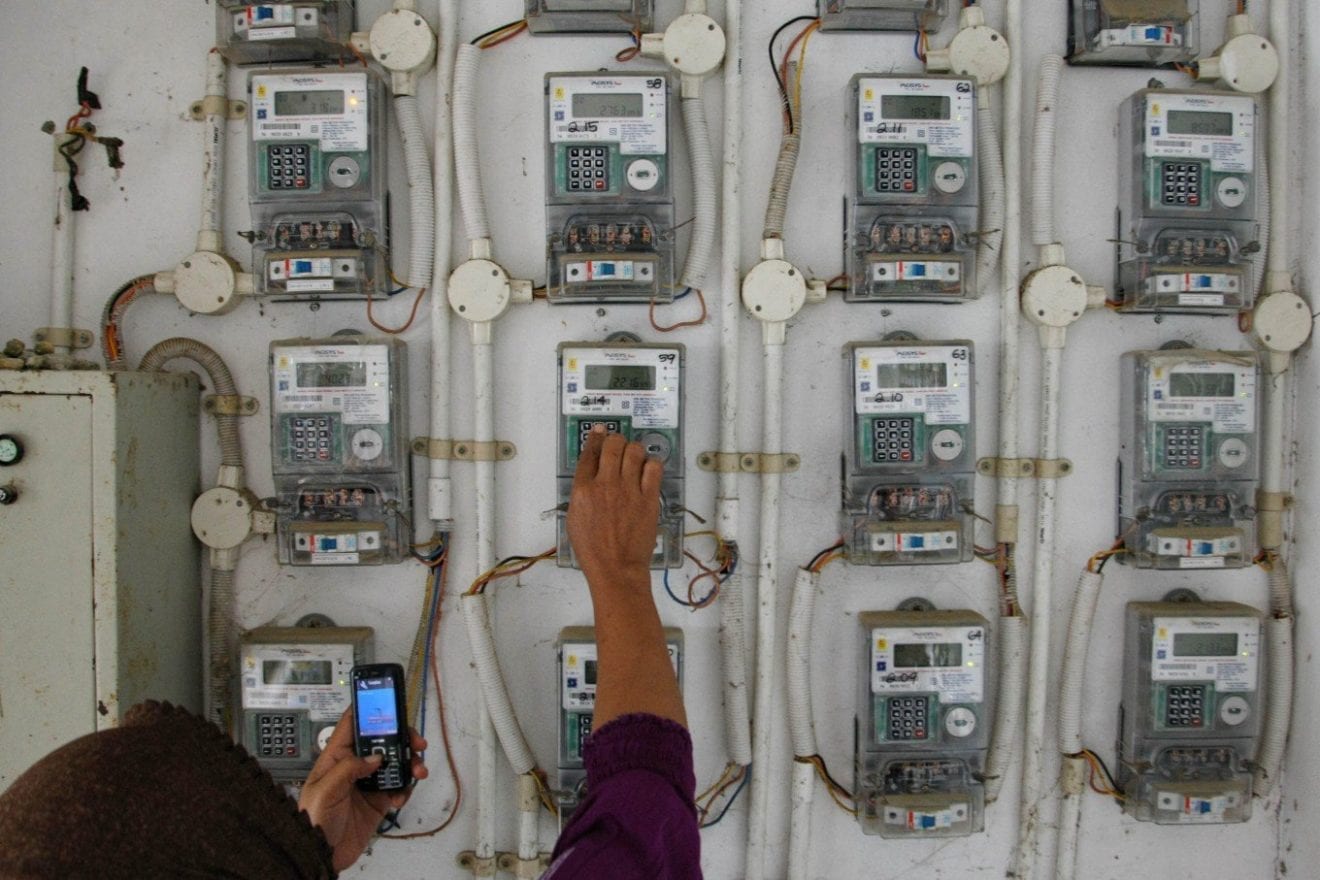
    Philippine authorities plan to eliminate the 12 percent value-added tax on electricity system loss charges from consumer and commercial utility bills as early as November 2026.

    The Energy Regulatory Commission issued Resolution No. 26, which reclassifies transmission and distribution losses as pass-through costs rather than taxable revenue for power generators, grid operators and distribution utilities.

    Energy Regulatory Commission Chairperson Francis Saturnino Juan confirmed during a Department of Energy budget hearing that the Bureau of Internal Revenue is drafting the required revenue memorandum circular. The tax agency plans to release the circular following a mandatory 15-day publication window, clearing distributors to update their billing systems.

    Bureau of Internal Revenue Commissioner Charlito Martin Mendoza stated that the adjustment ensures consumers no longer pay taxes on electricity that never reaches homes or businesses.

    The Seven Billion Peso Cleanup

    Lifting the tax does not remove the underlying system loss charges, which continue to appear on Philippine power bills. Energy Secretary Sharon Garin told lawmakers that eliminating the actual loss charges requires a phased program and significant capital expenditure across regional grids.

    System losses divide into technical and non-technical categories. Non-technical losses cover meter tampering, power theft, defective metering equipment and administrative billing errors. Department of Energy estimates indicate that eliminating non-technical loss allowances will require approximately 7 billion pesos in enforcement, meter replacements, database cleanups and cooperative management overhauls.

    Technical losses occur naturally across cables and transformers during transmission. Fixing them requires electric cooperatives and private utilities to replace ageing lines, upgrade substations and redesign local grid architecture.

    Legislative Limits and Network Audits

    Philippine commercial operators face some of the highest electricity tariffs in Southeast Asia, where utility line items consistently eat into store operating margins and household discretionary spending. While cutting the 12 percent tax offers immediate margin relief, dismantling the base charge faces statutory limits under the Electric Power Industry Reform Act, which permits distribution utilities to recover system losses up to regulatory caps.

    Electric cooperatives will take roughly six months to complete physical grid assessments before regulators can adjust allowable technical loss caps. Garin said the government expects to deliver its formal progress report on technical losses in the first half of 2027.

  • Indonesia Consumer Inflation Climbs to 3.19% in August

    Indonesia Consumer Inflation Climbs to 3.19% in August

    Indonesia’s headline inflation jumped to 3.19 per cent year on year in August 2026, driven by rising grocery bills, gold jewelry costs and higher transport fares.

    The increase from 2.28 per cent in July lifted the national consumer price index to 111.97 from 108.51 a year earlier, according to the Central Statistics Agency (BPS). The headline print remains inside Bank Indonesia’s target corridor of 2.5 per cent plus or minus one percentage point.

    Food and Personal Care Drive Basket Costs

    Food, beverages and tobacco delivered the heaviest punch to household budgets, climbing 3.86 per cent and adding 1.13 percentage points to the headline number. Broiler chicken, fresh fish, cooking oil and rice led the increases alongside bird’s eye chili, beef and cigarettes. Volatile food prices alone advanced 4.06 per cent over the twelve months.

    Personal care and other services recorded the steepest category increase at 9.25 per cent, contributing 0.63 percentage points. High retail demand and elevated prices for gold jewelry accounted for most of that category gain.

    Transportation expenses climbed 4.79 per cent from August 2025, adding 0.58 percentage points to headline inflation. BPS Deputy for Distribution and Services Statistics Ateng Hartono said higher gasoline prices, costlier airfares, vehicle lubricants, and rising prices for cars and motorcycles drove the transport index up.

    Core Price Pressures Across Provinces

    Core inflation, which strips out volatile food and government-regulated tariffs, stood at 2.92 per cent year on year. It contributed 1.87 percentage points to the overall index, buoyed by gold jewelry, prepared rice meals, cooking oil, mobile phones and laptops. Government-administered prices rose 3.32 per cent on higher household fuel and air travel costs.

    All 38 Indonesian provinces recorded annual price increases during the month. North Maluku logged the country’s highest regional inflation at 5.28 per cent, while North Kalimantan posted the lowest reading at 2.17 per cent.

    For consumer brands and supermarket operators, the sharp uptick in poultry and staple grain prices tests grocery basket sizes after a period of quiet monthly deflation in July. Packaged food manufacturers face immediate margin pressure across basic cooking ingredients, while discretionary retailers must contend with higher transport outlays eating into urban household disposable income.

    Bank Indonesia next reviews its benchmark policy rate later this month, with policymakers balancing rupiah stability against the latest pickup in core consumer prices.

  • Thailand Luxury Market Outpaces Singapore as Gen Z and Pop Culture Drive Sales

    Thailand Luxury Market Outpaces Singapore as Gen Z and Pop Culture Drive Sales

    Thailand has overtaken Singapore as Southeast Asia’s fastest-growing luxury market, led by surging demand from domestic Gen Z consumers and entertainment partnerships.

    High-end fashion houses are shifting resources and marketing budgets toward Bangkok as spending by younger Thai demographics outpaces historic regional benchmarks.

    Pop Culture Powers Store Footfall

    Luxury labels have accelerated brand ambassador appointments across both Korean and Thai entertainment industries. Global houses such as Dior, Gucci and Prada now regularly sign Thai actors and musicians, commonly grouped as T-pop talent, alongside established K-pop idols to front regional campaigns.

    These endorsements convert directly into store traffic across Bangkok’s prime shopping corridors. Flagship boutiques in malls such as Siam Paragon, IconSiam and EmSphere report elevated sales of ready-to-wear lines, leather goods and fine jewellery purchased by shoppers under 30.

    Regional Retail Balances Shift to Bangkok

    Singapore long served as the default gateway for luxury groups entering Southeast Asia, relying heavily on international business travellers and high-income expatriates. Bangkok, by contrast, combines resilient domestic demand with a rapid rebound in regional tourist arrivals from across Asia.

    Major European luxury groups are now expanding floor space in central Bangkok developments and revamping VIP salons rather than relying solely on Singaporean outposts. The shift marks a broader recalibration toward markets where pop culture fandom directly drives retail transaction volumes.

    Luxury brands will monitor upcoming mall completions along Bangkok’s Sukhumvit and Ploenchit corridors through 2024 to determine whether new retail square footage matches high-end consumer absorption rates.

  • Hong Kong Retail Sales Rise 4.5 per Cent to HK$31 Billion in July

    Hong Kong Retail Sales Rise 4.5 per Cent to HK$31 Billion in July

    Hong Kong retail sales climbed 4.5 per cent year-on-year in July to HK$31 billion ($3.95 billion), extending the city’s growth streak to 15 straight months.

    The result held steady against the revised 4.6 per cent increase recorded in June, bringing total retail sales expansion for the first seven months of the year to 8.9 per cent.

    Online purchases expanded faster than physical store traffic. E-commerce sales reached HK$2.8 billion in July, up 9.5 per cent from a year earlier, and represented 9.1 per cent of total retail turnover in the city.

    Jewellery and luxury goods lead gains

    High-value categories drove the bulk of the monthly expansion, according to figures released by the Census and Statistics Department. Sales of jewellery, watches and clocks jumped 19.7 per cent, while electrical appliances and consumer durables rose 11.5 per cent. Medicines and cosmetics gained 7.3 per cent.

    Everyday retail lines experienced much slower momentum. Department store commodities, optical shops, and alcoholic drinks and tobacco recorded uplifts ranging between 0.5 per cent and 1.8 per cent.

    Tourism events against external headwinds

    The sustained expansion points to firming domestic household incomes and stable employment across Hong Kong, even as store operators adjust to spending shifting online. The wide performance gap between luxury spikes and subdued department store receipts indicates local consumer sentiment remains selective outside tourist-heavy categories.

    City officials are counting on an upcoming lineup of mega-events to lift inbound visitor traffic through the rest of the year, while monitoring how evolving global economic headwinds affect local consumption.

  • Louis Vuitton Exits Chinese Province After Sales Drop and Trademark Dispute

    Louis Vuitton Exits Chinese Province After Sales Drop and Trademark Dispute

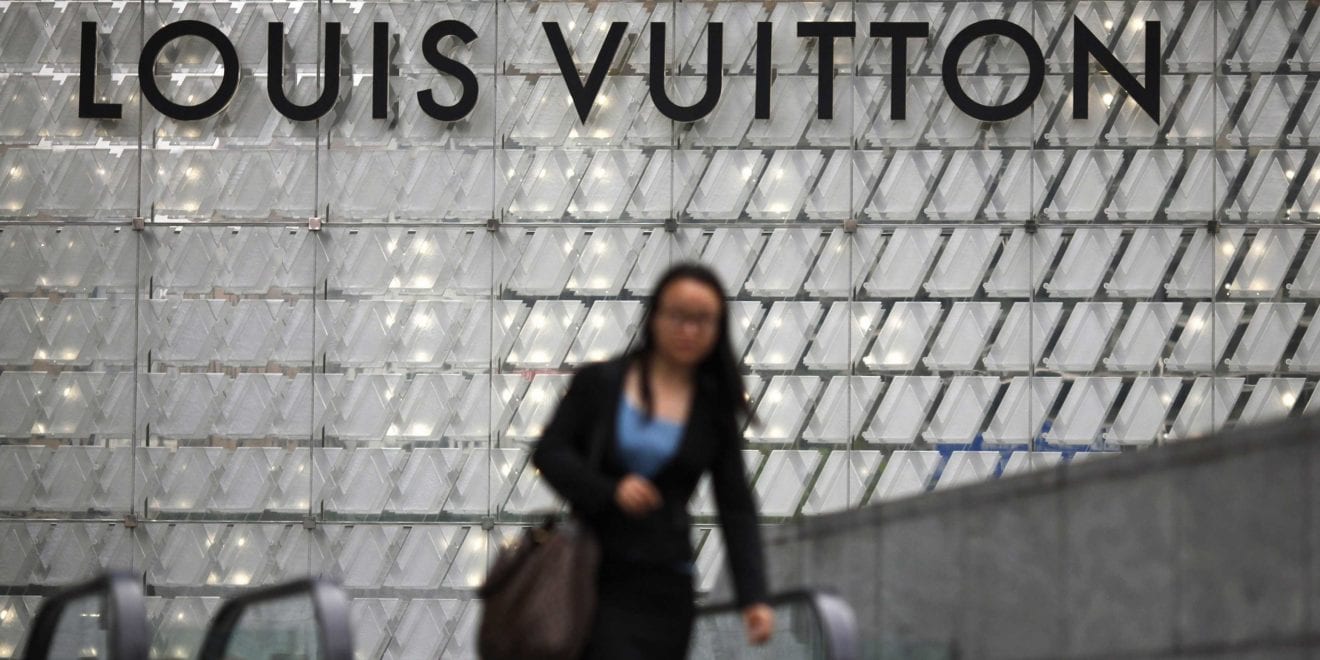
    Louis Vuitton closed its retail footprint in a Chinese province after local store sales dropped and a trademark dispute sparked consumer backlash against the French luxury house.

    The pullout follows intense public scrutiny in China over the brand’s legal enforcement of its intellectual property, which prompted pushback from shoppers and weakened foot traffic across regional department stores.

    Reassessing Regional Footprints

    Luxury groups in mainland China are reviewing their exposure to lower-tier provincial markets where operating costs outpace store revenue. Falling retail demand across secondary cities has pushed European fashion houses to trim underperforming storefronts and redirect capital toward flagship flagships in tier-one hubs.

    Shopper sentiment in the affected province turned sharply against the brand during the legal dispute. Local consumers shifted spending away from the label, accelerating management’s decision to shut down operations in the territory entirely.

    Consolidation in Core Hubs

    European luxury labels previously expanded across provincial capitals to capture rising domestic wealth outside Beijing and Shanghai. That expansion model now faces pressure as consumer spending concentrates in top-tier commercial centres and duty-free zones such as Hainan.

    LVMH continues to review its retail network across Greater China, with future store renewal deadlines and regional lease expiries determining where the group will prune or retain square footage.

  • China Beauty Market Targets 6 Percent Annual Expansion Through 2028

    China Beauty Market Targets 6 Percent Annual Expansion Through 2028

    China’s beauty market will expand at a 6 percent compound annual growth rate between 2024 and 2028, according to projections from consultancy McKinsey. The forecast follows a 3 percent expansion recorded in 2023 across the country’s cosmetics and skincare sectors.

    A 2025 survey showed that 75 percent of beauty executives are pushing to increase sales despite softer volume growth caused by inflation and cautious household spending. Retailers face rising customer acquisition costs across domestic e-commerce channels alongside extended product lifecycles.

    Squeezed Margins and Price Pressures

    Downward pricing pressures intensified over the past year across Chinese retail platforms. Consumers increasingly hunt for value, forcing brands to adjust promotional calendars and discount structures to defend shelf space.

    Foreign and domestic beauty brands are rethinking their operating models in response. Companies such as Changsha-based S’Young International are expanding integrated operations hubs to manage distribution and localization more efficiently.

    Shift Toward Capability Hubs

    International brands previously treated mainland China primarily as a volume driver for global sales. Today, rising domestic competition and fragmented digital channels require dedicated local research, formulation and supply chains within the market itself.

    The critical metric for brand managers in the coming quarters is whether average selling prices stabilize across major retail platforms before margins erode further.

  • Indian Gen Z Spends Three Times More on Quick Commerce Than Older Shoppers

    Indian Gen Z Spends Three Times More on Quick Commerce Than Older Shoppers

    Indian Gen Z shoppers spend three times more on quick commerce platforms for groceries than consumers over 30, allocating 2.6 per cent of their wallet share to instant delivery.

    By contrast, traditional supermarket chains such as D-Mart capture just 0.85 per cent of their spending, according to transaction data from credit-on-UPI fintech platform Kiwi. Consumers aged 30 and older continue to direct the bulk of their grocery budgets to physical stores and neighbourhood kirana shops.

    Shifting priorities in grocery and credit

    Younger shoppers in India are bypassing traditional discount hunting in favour of speed. Kiwi, which analysed 25,000 users between June and July 2026, found that Gen Z cardholders use credit selectively for high-value items while relying on app-based delivery for routine supplies.

    They also spend 20 per cent more on rental and education payments compared to older age groups, pointing to heavy reliance on credit for essential recurring living costs. When financing larger transactions through equated monthly instalments, Gen Z users consistently choose longer repayment windows to reduce monthly outgo, accepting higher overall interest charges in exchange for immediate budget flexibility.

    “Gen Z is not necessarily using credit more frequently; they are using it differently,” said Siddharth Mehta, co-founder and chief operating officer at Kiwi. “Our data shows that convenience is playing a much bigger role in how younger consumers make payment and credit decisions.”

    Everyday essentials dominate digital wallets

    The pivot toward speed over pricing rewards mirrors broader consumer shifts across South Asia, where instant delivery platforms like Blinkit, Zepto and Swiggy Instamart have eroded market share from established hypermarkets. A separate study of 520,000 users by payroll fintech SalarySe confirmed that Gen Z spending remains concentrated on essential living costs, utilities and recurring digital subscriptions managed through automated UPI mandates, rather than discretionary lifestyle splurges.

    Kiwi, which has issued more than 200,000 RuPay credit cards over the past two years, reported a 10 per cent higher wallet share among Gen Z users compared to millennials on its platform. Retailers and card issuers now face the challenge of retaining young consumers who show little loyalty to multi-card cashback schemes, focusing instead on whether quick commerce operators can sustain current delivery speeds as order volumes rise into the festive quarter.

  • Philippine Family Income Reaches 411,350 Pesos as Regional Wealth Gap Widens

    Philippine Family Income Reaches 411,350 Pesos as Regional Wealth Gap Widens

    Average annual family income in the Philippines climbed to 411,350 pesos in 2025, according to preliminary data from the Philippine Statistics Authority’s latest Family Income and Expenditure Survey.

    That nationwide figure works out to roughly 34,300 pesos a month, but earnings remain heavily skewed toward Metro Manila and industrial Luzon.

    Makati posted the highest average income among highly urbanized cities at 796,990 pesos per year, or about 66,400 pesos monthly. That is nearly double the national average and 2.5 times higher than Zamboanga City, which ranked lowest among major urban centers at 309,610 pesos. The next four top-earning cities all sit within Metro Manila: San Juan at 735,960 pesos, Parañaque at 711,310 pesos, Mandaluyong at 676,130 pesos, and Quezon City at 648,150 pesos.

    Metro Manila and Northern Luzon Lead

    Only three administrative regions surpassed the national average in 2025. The National Capital Region led with an average annual family income of 574,370 pesos, followed by Calabarzon at 526,070 pesos and Central Luzon at 447,310 pesos. At the bottom, the Bangsamoro Autonomous Region in Muslim Mindanao recorded 246,050 pesos, trailing Zamboanga Peninsula at 286,340 pesos and Soccsksargen at 292,820 pesos.

    Provincial data shows an even wider spread. Ilocos Norte topped all provinces with an average family income of 619,240 pesos, followed by Batanes, Cavite, Rizal, and Batangas. The bottom five provinces were all located in Mindanao, with Maguindanao del Sur recording just 177,750 pesos.

    Ilocos Norte expanded its household income by nearly 70 per cent between 2021 and 2025, rising from 364,800 pesos to 619,240 pesos. Remittances and business proceeds drove that surge. Overseas cash receipts accounted for 20.2 per cent of provincial family earnings, compared to an 8.5 per cent share nationally, while salaries contributed 39.8 per cent against a national average of 54.6 per cent.

    Uneven Growth Across Island Groups

    Retailers sizing up consumer demand outside Manila face sharply different spending trajectories. While high-income enclaves command basket size, secondary provinces are posting faster percentage gains. Cagayan Valley delivered the fastest regional increase between 2023 and 2025, expanding 25 per cent to 388,220 pesos, while Samar recorded a 54.4 per cent provincial jump to 357,340 pesos.

    Contraction hit other pockets. Sultan Kudarat saw average family income drop 8.2 per cent between 2023 and 2025 to 269,610 pesos. Income composition also split along regional lines: wage labor dominated every region except BARMM, where entrepreneurial activity generated 43.8 per cent of total household revenue.

    The statistics agency will publish the final 2025 expenditure tables and poverty threshold estimates in its complete survey release.

  • Hundreds of Asian Corporate Heavyweights Report Earnings in Peak Week

    Hundreds of Asian Corporate Heavyweights Report Earnings in Peak Week

    About 370 constituents of the MSCI Asia Pacific Index will report financial results this week, testing consumer demand across China and the resilience of hardware supply chains.

    The reporting group represents roughly 30 percent of the benchmark’s more than 1,200 member companies. Corporate updates from heavyweights across transport, consumer retail, energy, and component manufacturing will land over five consecutive trading sessions.

    Consumer and Automotive Focus

    Automotive manufacturer BYD Co. Leads the consumer batch as price competition across the electric vehicle sector shapes domestic delivery numbers and regional export margins. At the high end of retail, heritage jewellery brand Laopu Gold Co. Presents numbers that reveal how affluent shoppers in mainland shopping hubs are allocating capital.

    For retail and brand operators across Greater China, performance figures from domestic leaders provide a direct gauge of discretionary spending power. Previous reporting cycles showed shoppers trading down in mass categories while allocating funds toward premium gold assets and domestic electric mobility brands.

    Hardware and Industrial Benchmarks

    Technology components and infrastructure suppliers also feature heavily in the schedule. Optical transceiver maker Eoptolink Technology Inc. Reports alongside energy group PetroChina Co., offering detail on corporate spending in artificial intelligence architecture and baseline energy consumption.

    Investor attention centres on operating margins and forward order guidance across both consumer platforms and hardware exporters as balance sheets post through Friday.