Blog

  • JD.com Forecasts Rise in Home Appliance Sales in H2 Despite First Revenue Drop in Over a Decade

    JD.com Forecasts Rise in Home Appliance Sales in H2 Despite First Revenue Drop in Over a Decade

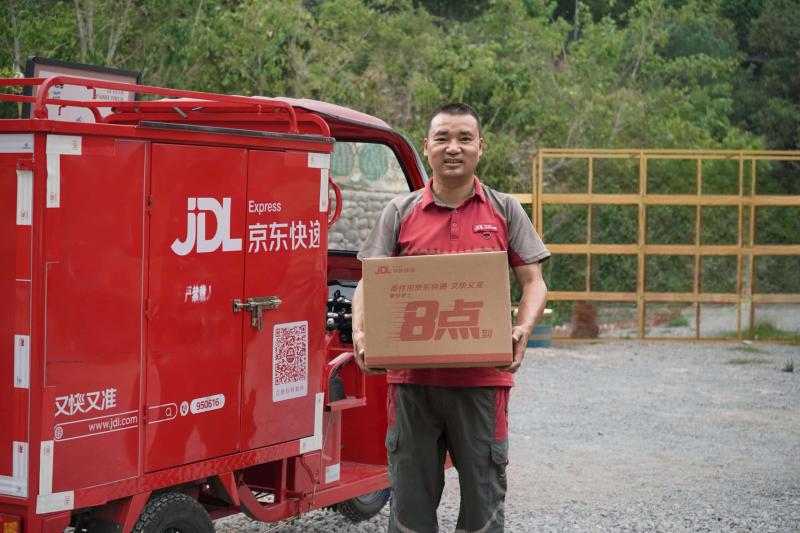
    JD.com, a prominent marketplace for consumer electronics in China, forecasted an uptick in home-appliance sales for the second half of the year during their recently held quarterly review. This projection was made despite their first reported decrease in quarterly income in over a decade.

    The CEO of the company, Sandy Xu, addressed the downturn in revenue from electronic and home appliances during a conference call with analysts. She attributed the decline to an elevated comparison base from the previous year and escalated raw material costs. However, she noted that there was a resurgence in momentum entering into June.

    Expectations for Growth

    As she peered into the coming months, Xu expressed her confidence in the potential growth of the consumer electronics category, even as its continually rising prices may continue to impact consumer demand adversely. She postulated that this growth will be “meaningful” and is partly due to the easing of the challenging year-on-year comparison.

    However, the impact of these predictions was somewhat dampened as US-listed shares of the company saw a decrease of 3.5 per cent in trading during the GMT 1342 time slot.

    The Uphill Task of Rejuvenating Consumer Spending

    Despite the setbacks, JD.com exceeded estimated quarterly revenue projections, with the annual 618 shopping festival playing a significant role. The festival, one of the country’s largest online retail events, ran for more days than previous years, offering retailers and brands additional time to vie for consumer spending via deep discounts and promotional campaigns.

    However, total revenues still saw a dip of 2.9 per cent, settling at 346.4 billion yuan (US$51.37 billion) in the quarter ending in June. This underlines the ongoing struggle to rejuvenate consumer spending in China. This struggle is exacerbated by consumer apprehension concerning job security and the prolonged downturn in China’s property sector, which has weakened consumer confidence.

    The company reported a net profit for the quarter of 7.1 billion yuan, a notable improvement compared to last year’s 6.2 billion yuan in the same period. The non-GAAP net profit for the quarter was 8.9 billion yuan, showing an impressive 20 per cent increase from the second quarter of 2025.

    Questions & Answers

    What factors were attributed to the recent dip in JD.com’s revenues?
    The decline in revenues was attributed to an elevated comparison base from the previous year and increased raw material costs.

    What is the company’s projection for the second half of the year?
    JD.com predicts an increase in home-appliance sales during the second half of the year.

    How does JD.com plan to rejuvenate consumer spending?
    One strategy is through extended online retail events like the annual 618 shopping festival which offers deep discounts and promotional campaigns to consumers.

  • DFI Secures Exclusive Franchisee Rights for GNC Health Products in Singapore

    DFI Secures Exclusive Franchisee Rights for GNC Health Products in Singapore

    DFI Retail Group is set to become the sole wholesaler, distributor, and franchisee of GNC’s wellness and health products in Singapore. This move represents an extension of the existing strategic partnership between the two firms.

    DFI will employ its resources in sales, marketing, distribution, and logistics to facilitate the availability of GNC’s scientifically-supported health and wellness products through the Guardian Singapore network. This expansion is a continuation of a 20-year-long alliance between the two companies, previously established in Hong Kong. Here, GNC’s products were made available through independent outlets and DFI’s health and beauty chain, Mannings. This development also signifies the conclusion of a drawn-out legal dispute between GNC’s US parent company and its former partner in Singapore.

    Curtis Liu, CEO for health & beauty at DFI, expressed his enthusiasm about the venture. He highlighted DFI’s deep market knowledge and extensive retail network as significant factors enabling them to bring GNC’s leading sports nutrition and health supplements back to Singapore. Customers will now have access to a handpicked range of credible, scientifically-proven health solutions via Guardian, Mannings, and exclusive GNC stores.

    Having established its presence in Singapore in 1997, GNC recently received a positive ruling from the Singapore Court of Appeal which reinforced GNC’s rights to fully assume former store leases. This decision paves the way for GNC to regain an independent store presence in Singapore. The company is currently working on the assignment of the pertinent store leases.

    From the fourth quarter of this year, customers in Singapore will be able to purchase GNC’s products, including vitamins, minerals, and sports nutrition, through both physical and online stores of Guardian, as well as GNC’s standalone stores.

    Cheri Mullen, Chief Global Franchise and Wholesale Officer at GNC, expressed her anticipation to reinstate GNC’s store presence in Singapore. She emphasized their commitment to rebuilding and fortifying their market presence while maintaining the delivery of high-quality, innovative, and science-backed wellness solutions, as per customer expectations.

    As a part of the expanded cooperation, DFI will also become GNC’s exclusive franchisee in Macau.

    Questions & Answers

    What will be the role of DFI Retail Group in the partnership with GNC?
    DFI will serve as the exclusive wholesaler, distributor, and franchisee of GNC’s health and wellness products in Singapore. It will provide sales, marketing, distribution, and logistics services for GNC products through the Guardian Singapore network.

    What does the collaboration between DFI and GNC mean for customers in Singapore?
    Customers in Singapore will gain access to a wide range of GNC’s health and wellness products, including vitamins, minerals, and sports nutrition, through Guardian’s physical and online stores, as well as GNC’s standalone stores starting the fourth quarter of this year.

    What recent legal decision has allowed GNC to expand its presence in Singapore?
    The Singapore Court of Appeal recently upheld and enforced GNC’s rights to assume former store leases in full, enabling GNC to regain an independent store presence in Singapore.

  • Revolutionizing Bangkok Commute: Single Ticket Policy Caps Electric Rail Fares at $1.36 for 2027 Launch

    Revolutionizing Bangkok Commute: Single Ticket Policy Caps Electric Rail Fares at $1.36 for 2027 Launch

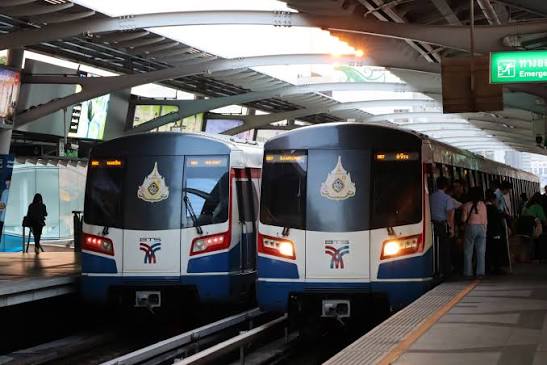
    Thailand has announced its intention to implement a common-ticket policy for electric rail services in Bangkok and the surrounding provinces. This initiative, which is expected to commence next year, will cap fares at 45 baht (US$1.36) per journey to streamline the public transportation system. Additionally, an initial cost of no more than 17 baht will be instituted, which will not be re-imposed if travelers switch to another line, as stated by Deputy Transport Minister Siripong Angkasakulkiat at a recent official gathering.

    Unifying Public Transportation

    The aim of the new fare bracket is to render Bangkok’s disjointed urban rail network more user-friendly. At present, passengers are required to negotiate separate ticketing systems, fare structures, and payment methods when moving between lines. The current SkyTrain fares can amount to as much as 65 baht, depending on the route, as per the Bangkok Mass Transit System’s data.

    The common-ticket policy’s legal and administrative procedures are projected to be finalized by November 2026. System testing is set to commence in December, leading up to the introduction of the common-ticket measure on January 1, 2027.

    Growth of the BTS SkyTrain

    The BTS SkyTrain, which began operations in December 1999 as Bangkok’s premier mass-transit rail system, has seen substantial upgrades since its inception. The original core network has expanded significantly to include approximately 68 kilometers of lines and 60 stations.

    In the last year, the BTS SkyTrain noted a 5.6% increase in ridership from 2024, recording a total of 205.4 million journeys.

    Questions & Answers

    What is the proposed common-ticket policy in Thailand?
    The common-ticket policy is a projected initiative by the Thai government to cap fares at 45 baht per trip for electric rail services in Bangkok and surrounding provinces. An initial charge of up to 17 baht will be imposed, which will not be repeated if passengers switch lines during their journey.

    Why is this policy being introduced?
    The policy aims to simplify navigation of Bangkok’s urban rail network, which currently requires passengers to negotiate separate ticketing systems, fare structures, and payment methods while transferring between lines.

    When is the common-ticket policy expected to be implemented?
    The common-ticket policy is expected to take effect on January 1, 2027, with system testing set to begin in December 2026.

  • Affordable Canadian Lobsters Conquer Vietnamese Market with Freshness and Flavor

    Affordable Canadian Lobsters Conquer Vietnamese Market with Freshness and Flavor

    Canadian lobsters are increasingly gaining favor among Vietnamese consumers, primarily due to their affordability compared to Australian lobsters and some local varieties. Hoa, a HCMC resident and a frequent seafood consumer, shared her recent preference for Canadian lobsters, citing their reasonable pricing, freshness, and high quality.

    Canadian Lobsters: A Budget-Friendly Option

    Seafood markets in HCMC offer Canadian lobsters, each weighing between 500 and 600 grams, at prices ranging from VND950,000 to VND1.1 million per kilogram (equivalent to US$36-42 per kilogram). Larger lobsters, weighing one kilogram or more, are priced around VND1.3-1.4 million per kilogram. These prices reflect a decrease of 5-10% compared to the previous year.

    In comparison, Australian lobsters are priced at VND3.5 million per kilogram, Vietnamese spiny lobsters near VND3 million, and local rock lobsters around VND1.5 million. The attractive pricing of Canadian lobsters has led to a surge in their imports. Data from Vietnam Customs indicates that Vietnam imported seafood worth approximately $34 million from Canada in the first seven months of the year, marking an increase of 42% compared to the same period last year. Lobsters accounted for almost 60-65% of this total import value.

    Rising Demand for Canadian Lobsters

    Canadian lobsters are not only gaining popularity due to their affordability, but also their versatility and accessibility. An increasing number of businesses, supermarkets, and online platforms are offering these lobsters, further widening their consumer base. Many restaurants and eateries now include Canadian lobsters in their seafood platters, making it possible for groups and families to enjoy lobsters without excessive expenditure.

    Tran Van Truong, CEO of seafood chain Hai San Hoang Gia, pinpoints price as a key factor driving the growing demand for Canadian lobsters. He reported a double-digit year-on-year increase in his company’s imports of Canadian lobsters for the first seven months of this year. Truong also highlighted the seasonal advantage of Canadian lobsters, which are abundantly available from July to September. While these lobsters may not match the quality of Vietnamese lobsters, they have a robust supply chain and exhibit good survival rates, ensuring minimal losses during transport and storage.

    Additional factors contributing to the lower prices of Canadian lobsters include import tariffs. Canadian lobsters that fulfill the Comprehensive and Progressive Agreement for Trans-Pacific Partnership requirements attract a 0% tariff when imported into Vietnam.

    Canada, the world’s largest lobster exporter, recorded the highest export of any fisheries items in 2025 at 79,380 tons of lobsters valued at $3.01 billion, according to Fisheries and Oceans Canada.

    Questions & Answers

    Why are Canadian lobsters becoming popular in Vietnam?
    Their popularity is largely attributed to their affordability compared to other varieties. They’re also versatile and increasingly accessible through various outlets, including online platforms.

    What factors contribute to the lower price of Canadian lobsters?
    Factors include a robust supply chain, good survival rates which minimize losses during transport and storage, and a favorable import tariff of 0% when they meet the Comprehensive and Progressive Agreement for Trans-Pacific Partnership requirements.

    How does the quality of Canadian lobsters compare to other varieties?
    While the quality of Canadian lobsters may not match that of Vietnamese lobsters, they offer a satisfying taste and texture, making them a value-for-money choice among consumers.

  • Singapore’s Sentosa Cove: Once a Luxury Haven, Now a Hotspot for Residential Resale Losses

    Singapore’s Sentosa Cove: Once a Luxury Haven, Now a Hotspot for Residential Resale Losses

    Over the past three years, approximately 64.5% of residential resale transactions in Singapore’s exclusive Sentosa Cove district have resulted in losses, according to data from local real estate platform, Mogul.sg. This figure marks a rise from the 62.8% recorded between March 2020 and April 2023. The lackluster performance of this affluent enclave, once hailed as a haven for the wealthy, has been attributed to diminished demand from both foreign and local buyers.

    Performance of Property Types and Loss Analysis

    The study found that landed properties fared marginally better than condominiums, with around half of the resales since 2023 yielding a profit. The average loss on unprofitable resales decreased by 18% to S$1.28 million (US$1 million), however, the gross gains on profitable sales also dipped significantly, approximately 62%, to S$655,590. These figures do not account for additional costs such as stamp duties, property taxes, legal fees or agent commissions.

    Property consulting firms Cushman & Wakefield and Newmark similarly noted a trend towards loss-making resales in the area.

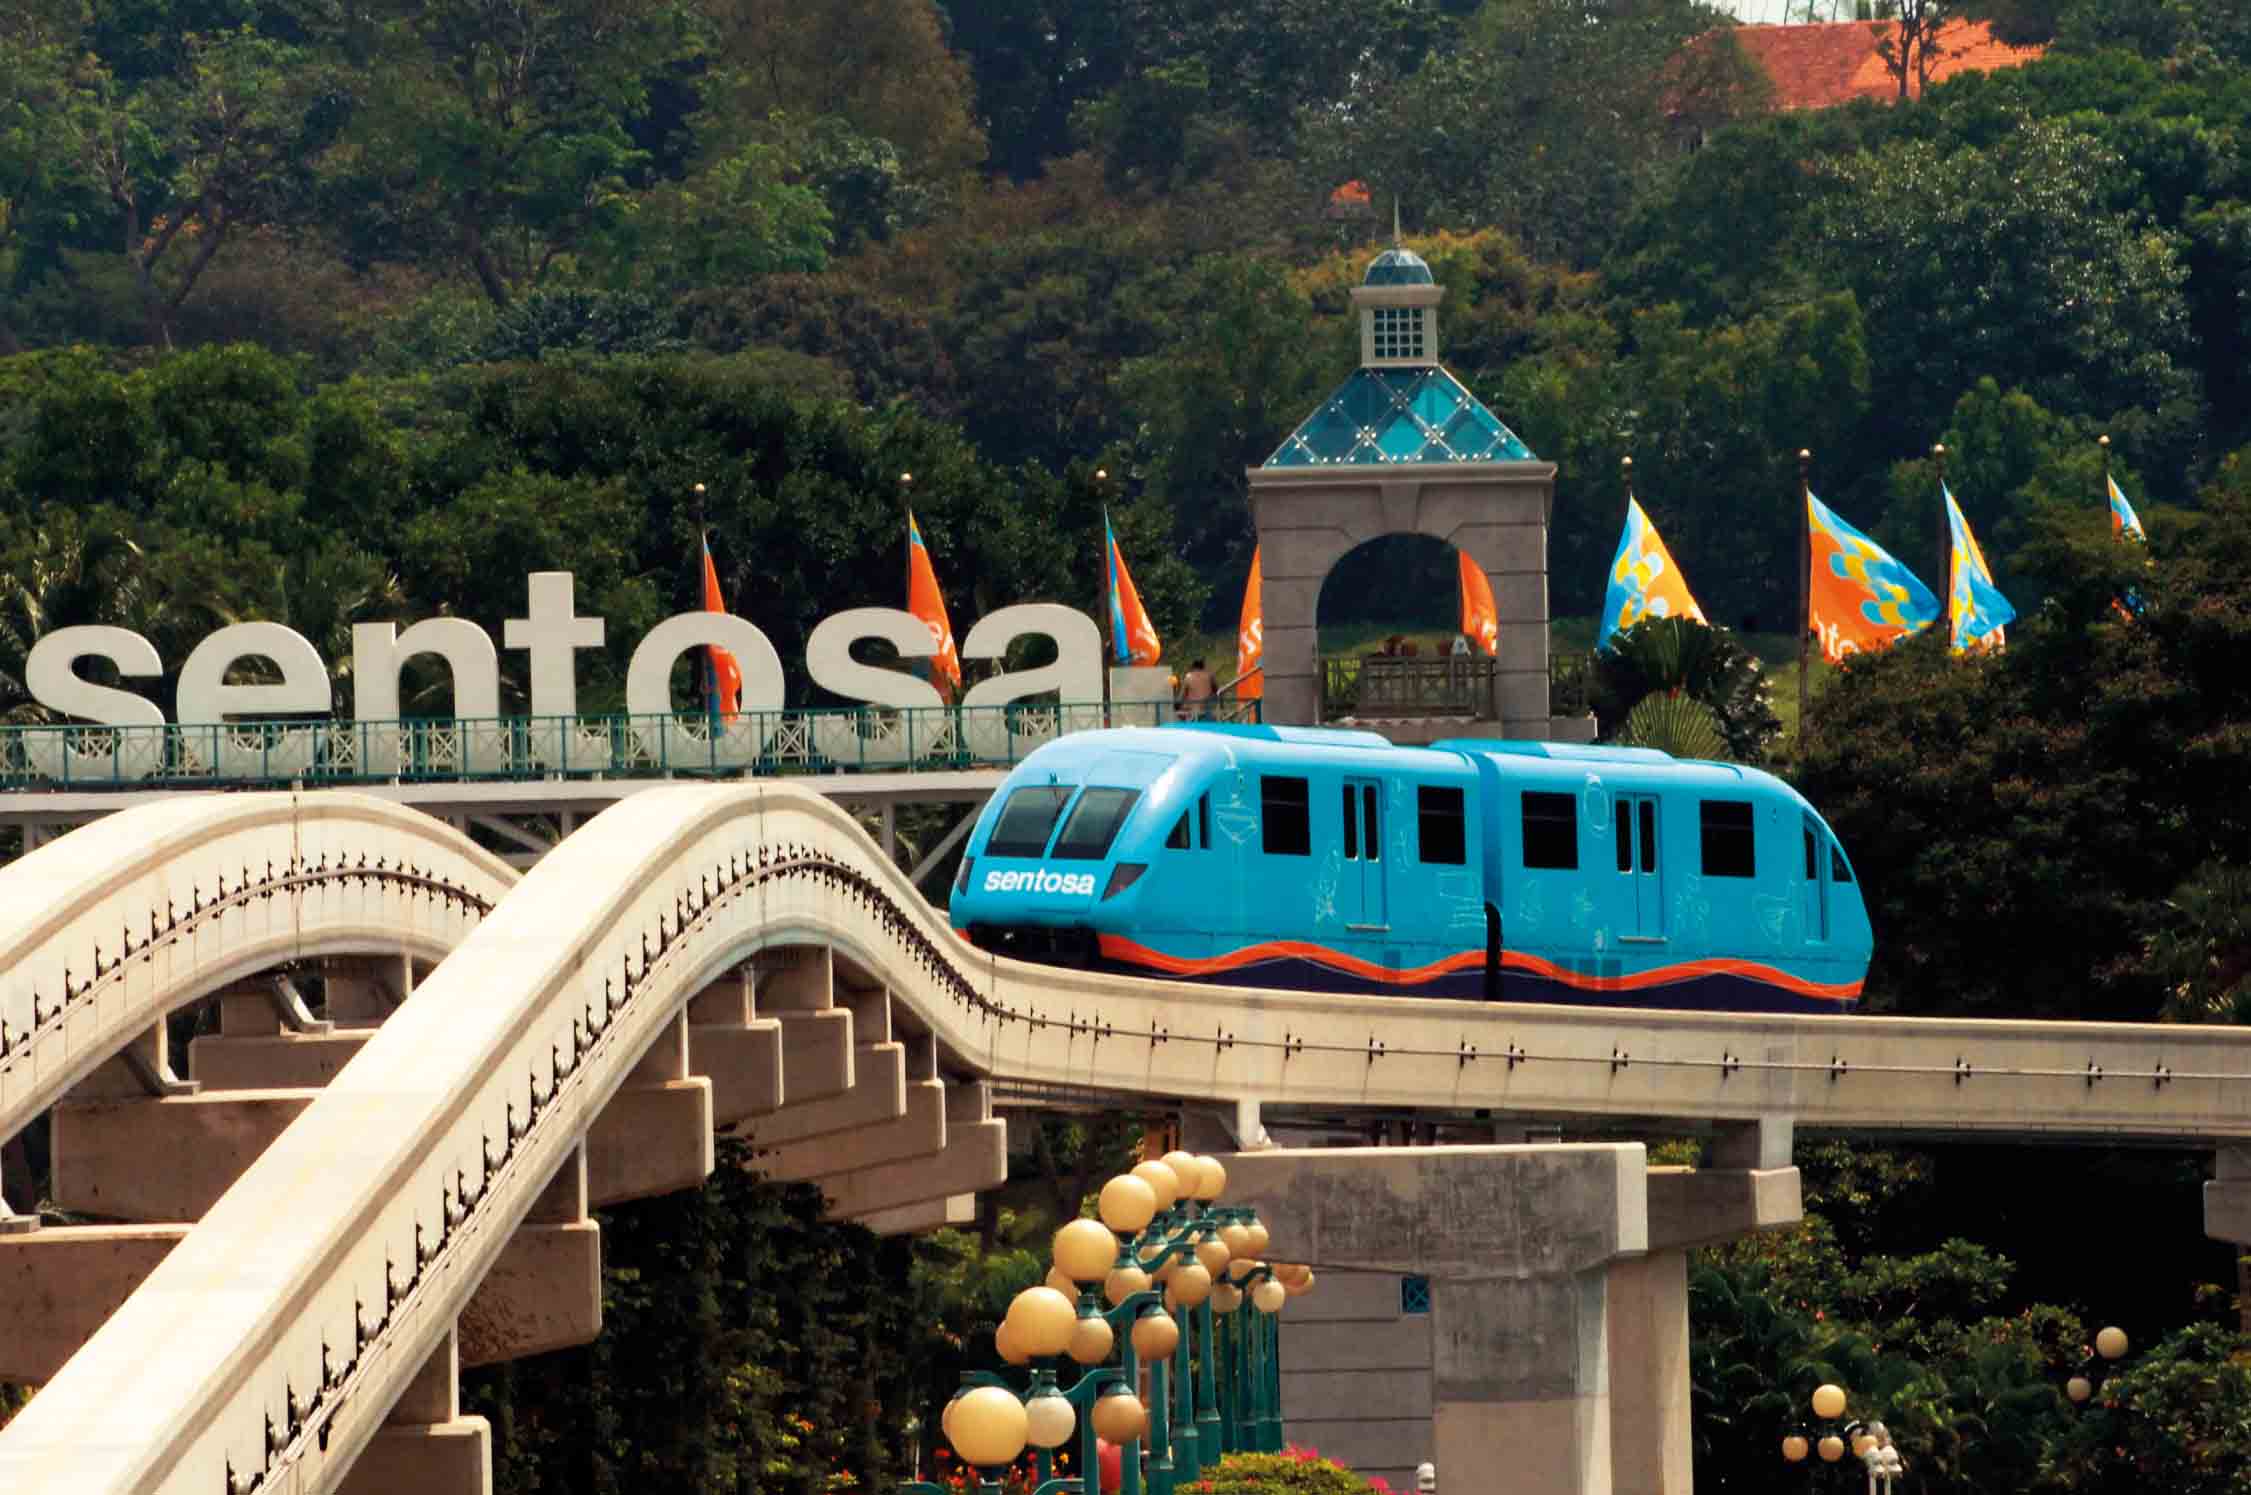
    Located on the eastern end of the 5-square-kilometer Sentosa Island, Sentosa Cove was transformed from a military outpost into a leisure and tourism hub in the 1970s. The enclave, which was developed primarily on reclaimed land and consists of five man-made islands (namely Coral, Paradise, Treasure, Sandy, and Pearl), was initially conceived as a high-end residential hotspot for affluent foreigners.

    Once marketed as Singapore’s answer to Monte Carlo or Dubai’s Palm Jumeirah, the enclave used to enjoy robust sales, driving up property prices. This was partly due to exemptions from mainland property restrictions and the unique provision allowing foreigners to purchase landed homes, albeit with government approval.

    Declining Demand and Current Challenges

    Since the 2008 global financial crisis and subsequent increases in Singapore’s additional buyer’s stamp duty, demand for properties in the enclave has dwindled. The tax, imposed on top of the standard buyer’s stamp duty, was raised to 60% in April 2023 for most foreign buyers, contributing to the decline in demand.

    Nicholas Mak, chief research officer of Mogul.sg, attributed the waning interest in Sentosa Cove to several factors. These include a halt in new residential developments, limited accessibility, and harsh coastal conditions. Moreover, no residential land parcels in Sentosa Cove have been sold since 2008.

    Further compounding the issue is a stipulation preventing foreign owners from leasing out their standalone homes. Consequently, several properties have been left vacant for extended periods, as their owners reside abroad or occupy other residences on the mainland.

    The lack of amenities such as shopping malls, wet markets, and hawker centers has also been identified as a reason for the enclave’s lack of appeal among Singaporeans.

    Questions & Answers

    What is the current state of residential resale transactions in Sentosa Cove?
    Approximately 64.5% of residential resale transactions in Sentosa Cove have resulted in losses over the past three years.

    What factors are contributing to the declining demand for properties in Sentosa Cove?
    The declining demand can be attributed to several factors including increased buyer’s stamp duty for foreign buyers, lack of new developments, limited accessibility, and harsh coastal conditions.

    How has the rule that prevents foreign owners from renting out their standalone homes impacted the Sentosa Cove property market?
    This rule has resulted in numerous properties being left vacant for extended periods, thereby reducing the attractiveness and vibrancy of the enclave.

  • China-ASEAN Trade Rockets to $643B in H1 2026 Bolstered by Growing Supply Chain Integration

    China-ASEAN Trade Rockets to $643B in H1 2026 Bolstered by Growing Supply Chain Integration

    In the first half of 2026, trade between China and the Association of Southeast Asian Nations (ASEAN) reached an impressive 4.34 trillion yuan (US$643.2 billion), marking an 18.2% increase from the same period the previous year. With an upswing of 24.5%, intermediate goods trade, including parts, components, and production inputs, accounted for roughly two-thirds of the total trade, amounting to around 2.86 trillion yuan.

    Integration of Chinese and ASEAN Industrial and Value Chains

    The General Administration of Customs of China (GACC) spokesperson, Lyu Daliang, attributed the steady growth in intermediate goods trade to the deepening integration and connectivity between Chinese and ASEAN industrial and value chains.

    In parallel, the latest statistics from Nanning Customs revealed that trade between China’s Guangxi Zhuang Autonomous Region and ASEAN reached 248.21 billion yuan in the first seven months of 2026 – a 2.5% increase year-on-year. This represented a new record for the period. Of note is the fact that trade with Vietnam increased by 3.3% to 183.71 billion yuan.

    Freight trains between Guangxi and Vietnam now operate daily, up from three services a week. These trains carry electronics and machinery southbound and transport tropical fruits like durians and mangosteens northbound.

    Boosting Trade through the Regional Comprehensive Economic Partnership

    The Regional Comprehensive Economic Partnership (RCEP), a 15-member trade agreement involving China, Japan, the Republic of Korea, Australia, New Zealand, and 10 ASEAN countries, has been a crucial framework supporting regional trade.

    All 15 signatories have fully implemented the RCEP since June 2023. The agreement’s rules of origin stipulate that materials originating in one member country and used in production in another member country are considered originating materials of the latter.

    The head of the Institute of International Market Research under China’s Ministry of Commerce, Xu Yingming, stated that the RCEP and the China-ASEAN Free Trade Area have reduced transaction costs and facilitated the closer integration of regional industrial chains.

    An ever-expanding China-ASEAN transport network continues to facilitate the smooth movement of resources while driving a surge in trade. The China-Laos Railway, which began operations in December 2021, recorded 17.17 billion yuan in import-export cargo value in the first half of 2026, a year-on-year increase of 33.8%.

    Questions & Answers

    What was the total value of China-ASEAN trade in the first half of 2026?
    The total value of China-ASEAN trade reached 4.34 trillion yuan (US$643.2 billion) in the first half of 2026.

    How has the Regional Comprehensive Economic Partnership (RCEP) impacted regional trade?
    The RCEP has significantly reduced transaction costs and facilitated a closer integration of regional industrial chains, thereby boosting regional trade.

    What has been the impact of the China-Laos Railway on trade?
    The China-Laos Railway has facilitated the smooth movement of resources and driven a surge in trade, recording 17.17 billion yuan in import-export cargo value in the first half of 2026.

  • ZUS Coffee Brews Buzz with Potential $245M IPO, Bolstering Malaysias Coffee Industry

    ZUS Coffee Brews Buzz with Potential $245M IPO, Bolstering Malaysias Coffee Industry

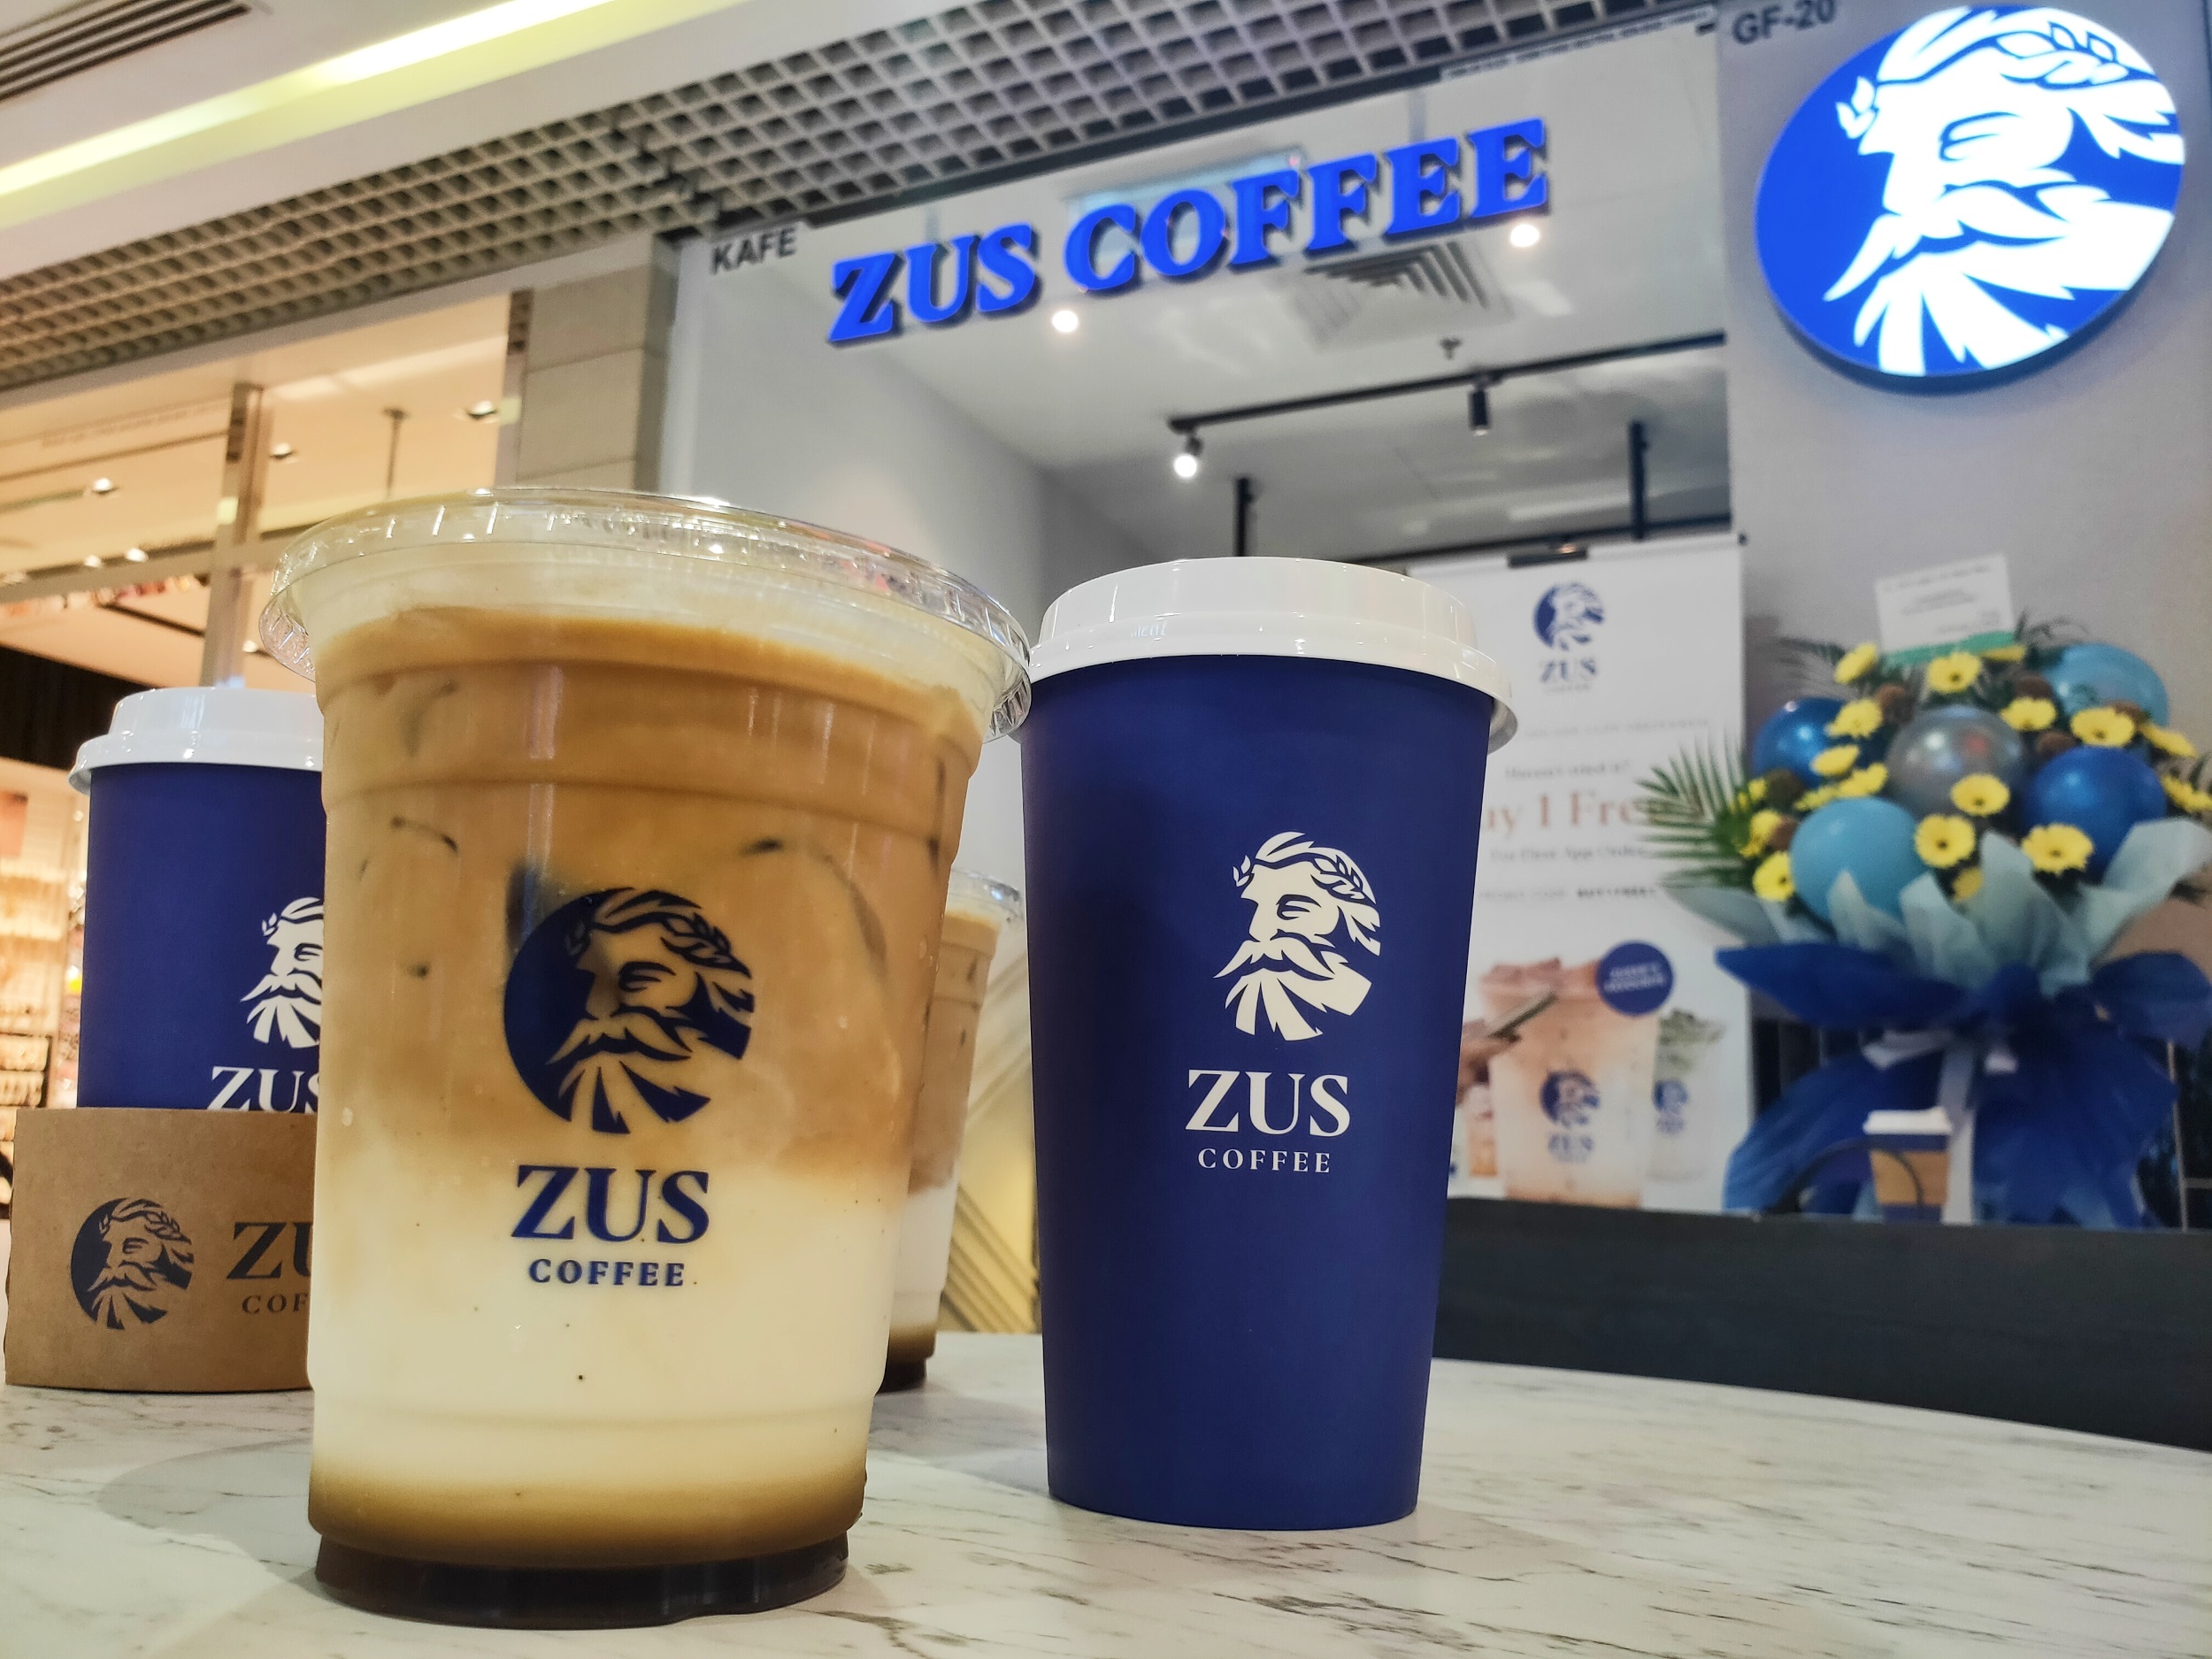
    ZUS Coffee, Malaysia’s largest coffee chain, is reportedly considering an initial public offering (IPO) for its Malaysia business that could generate a minimum of RM1 billion (US$245 million). Zuspresso, the brand’s owner, is teaming up with financial advisors to potentially launch the IPO as early as mid-2027. The valuation of the project could reach RM4 billion. However, the magnitude and timing of this venture are still under negotiation.

    Rapid Growth to Market Dominance

    ZUS Coffee, which began as a small kiosk in 2019, rapidly grew into Malaysia’s largest chain by store count by 2024, overtaking Starbucks. The company targeted the mid-priced segment of the coffee market, which was relatively underserved at the time of its inception. A standout feature of ZUS Coffee’s business model is its technological approach, featuring an app that allows customers to pre-order and collect their purchases in-store. This app also provides valuable insights into customers’ preferences, facilitating data-driven product development.

    Expansion Plans

    Currently, ZUS Coffee operates over 1,000 stores globally, the majority of which are in Malaysia. The company has also expanded into other markets such as Singapore, Brunei, the Philippines, Thailand, and Indonesia. Earlier this year, ZUS Coffee announced its ambitious plan to expand its network to 1,300 outlets by the end of 2026. This expansion includes adding 200 more stores in Malaysia.

    Questions & Answers

    What is the projected value of ZUS Coffee’s IPO?
    The IPO could potentially value ZUS Coffee’s business at RM4 billion.

    What sets ZUS Coffee’s business model apart?
    ZUS Coffee utilizes a tech-driven business model, featuring an app that allows customers to place orders in advance and collect them at stores. The app also provides the company with valuable customer preference data, supporting data-led product development.

    What are ZUS Coffee’s expansion plans?
    ZUS Coffee intends to grow its network to 1,300 outlets by the end of 2026, with an additional 200 stores planned in Malaysia.

  • Indonesia Climbs the Ranks as 4th Largest Food & Beverage Exporter in ASEAN, Eyeing More Global Growth

    Indonesia Climbs the Ranks as 4th Largest Food & Beverage Exporter in ASEAN, Eyeing More Global Growth

    Indonesia is emerging as an influential player in the food and beverage (F&B) industry. According to Dyah Roro Esti, Indonesia’s Deputy Minister of Trade, the nation’s F&B exports have accumulated a value of $6.25 billion. This figure positions Indonesia as the fourth-leading F&B exporter in the Association of Southeast Asian Nations (ASEAN), trailing Thailand, Vietnam, and Singapore.

    Indonesian F&B Industry: Potential for Expansion

    Esti shared these insights during the Indonesia Food and Beverage Trade Promotion Forum held in Jakarta. She emphasised that the F&B sector has significant prospects for expansion and growth. The Ministry of Trade is actively encouraging local businesses to explore international markets via Indonesia’s extensive global trade network.

    Comparatively, Indonesia’s F&B exports rank fourth in ASEAN nations, following Thailand ($17 billion), Vietnam ($8.8 billion), and Singapore ($6.5 billion).

    Esti pointed out the robust potential for Indonesian F&B products in international markets, particularly the ones complying with halal standards. Highlighting the Middle East as a promising marketplace, she expressed optimism about the export prospects for Indonesian businesses.

    Support for Domestic Businesses

    To propel domestic businesses, the trade ministry is utilizing a network of Trade Attachés and Indonesian Trade Promotion Centers in 33 countries. This framework aims to facilitate connections between Indonesian enterprises and potential overseas partners and purchasers.

    Indonesian food products are steadily gaining a firmer foothold in international markets. This growth is attributed to the continuous overseas expansion of local businesses and restaurants. Additionally, the global Indonesian diaspora serves as a substantial market for the country’s F&B products.

    In conclusion, the Ministry of Trade believes that leveraging its international trade network, penetrating new markets, and capitalizing on the rising demand for halal food will be instrumental in boosting exports in the future.

    Questions & Answers

    What is the current value of Indonesia’s food and beverage exports?
    As per Indonesia’s Deputy Minister of Trade, Dyah Roro Esti, the nation’s food and beverage exports have reached a value of $6.25 billion.

    What strategy is the trade ministry employing to support domestic businesses?
    The trade ministry is leveraging a network of Trade Attachés and Indonesian Trade Promotion Centers in 33 countries to help domestic businesses connect with potential overseas partners and buyers.

    What’s the significance of halal standards for Indonesia’s food and beverage industry?
    Halal compliant food and beverage products have a robust potential in international markets, particularly in the Middle East. The trade ministry sees the rising global demand for halal food as an opportunity to boost Indonesia’s exports.

  • China’s Telecom and Pay-TV Revenue Set for Steady Growth, Fueled by 5G and IoT Innovations: 2030 Forecast

    China’s Telecom and Pay-TV Revenue Set for Steady Growth, Fueled by 5G and IoT Innovations: 2030 Forecast

    Revenues generated from telecommunications and pay-TV services in China are set to witness a moderate compound annual growth rate (CAGR) of 1.3% from 2025 to 2030. This growth can be primarily attributed to innovative developments in mobile data and fixed broadband sectors.

    Telecommunications Revenue Forecast

    While the revenues from mobile voice services are expected to experience a downward trend during this period, mobile data service revenues are projected to rise. The declining trend in mobile voice services can be linked to mobile operators packaging voice minutes along with their 5G data plans, a shift in consumer preferences towards Over the Top (OTT) and internet-based communication applications, and a decrease in average revenue per user (ARPU) for voice services.

    On the other hand, the revenues from mobile data services are projected to increase at a CAGR of 4.2%, driven by a constant rise in 5G subscriptions and an ensuing boost in mobile data ARPUs. This growth in mobile data revenue is also expected to benefit from an increase in mobile internet usage and the widespread use of digital and video streaming services facilitated by premium mobile data offerings from mobile network operators (MNOs).

    Subscriptions to machine-to-machine (M2M) and Internet of Things (IoT) services are anticipated to consistently grow between 2025 and 2030, driven by advancements in 5G network infrastructure, smart city projects, industrial automation, and the focus of telecom companies and the government on new M2M/IoT applications.

    Fixed Communication and Pay-TV Services

    In the fixed communication services sector, revenues from fixed voice services are likely to decrease due to a drop in circuit-switched subscriptions and lower fixed voice ARPU. Conversely, the revenues from fixed broadband services are anticipated to increase, fueled by a growing number of users adopting higher-ARPU fiber broadband services and enhancements in gigabit networks nationwide.

    While the growth in cable TV and IPTV segments is projected to be minimal, the total revenue from pay-TV services in China is expected to experience a slight decline due to falling ARPU levels as consumers increasingly turn towards OTT and on-demand streaming platforms.

    Questions & Answers

    What are the factors driving the growth of telecommunications revenues in China?
    The growth of telecommunications revenues in China is largely propelled by advancements in mobile data and fixed broadband sectors, alongside a steady rise in 5G subscriptions and mobile data ARPUs.

    How is the fixed communication services sector expected to perform between 2025 and 2030?
    While revenues from fixed voice services are forecasted to decrease, revenues from fixed broadband services are predicted to grow, driven by an increasing number of users adopting higher-ARPU fiber broadband services and nationwide gigabit network enhancements.

    What is the projected trend for the pay-TV services in China?
    The total revenue from pay-TV services in China is expected to experience a slight decline due to falling ARPU levels as consumers increasingly shift towards OTT and on-demand streaming platforms.

  • Chinese Companies Grapple with Rising Payment Delays amidst Intense Competition

    Chinese Companies Grapple with Rising Payment Delays amidst Intense Competition

    In an environment marked by frail demand and severe competition, Chinese companies are allowing customers an extended period to clear their invoices. However, these businesses are still enduring extended periods waiting for overdue payments, a situation that is increasing the pressure on corporate cash flows.

    Mainland Chinese firms, on average, offer payment terms of 81 days, which is longer when compared to the 70-day average across the Asia-Pacific, according to a recent survey by Coface. Although these terms are more lenient, 86% of Chinese companies reported experiencing payment delays. This figure is marginally lower than the APAC average of 91%, but settlement of these overdue invoices in China takes about 73 days on average, five days longer than the regional average.

    Worsening Payment Conditions

    The state of payment conditions has deteriorated in the past year. Approximately 35% of survey respondents stated that payment delays have become more frequent, while 26% reported some improvement. Concurrently, 33% mentioned that delays had become more severe, in contrast to 27% who reported an improvement.

    Looking to the future, 40% of Chinese companies anticipate further deterioration of payment conditions in the coming 12 months, and only 20% plan to tighten the payment terms they offer customers. Coface credited this strain to a combination of factors such as trade and tariff volatility, consistent weak demand, and intense price competition in various Chinese industries.

    The survey’s findings align with a broader economic perspective. At the end of June, accounts receivable at China’s industrial enterprises increased by 8.1% year on year. The average collection period lengthened from 70.9 days to 71.7 days.

    Fewer Defaults but Larger Losses

    Chinese companies reported fewer customer defaults than their regional counterparts, with only 16% experiencing at least one default in the past 12 months, in contrast to the APAC average of 45%. Yet, when defaults did occur, the financial impact was more significant. Defaulted receivables made up 11.2% of total accounts receivable among Chinese suppliers, compared to 10% across APAC. This effect was particularly noticeable in the wood and chemicals industries, where about 20% of receivables were written off as defaults.

    Questions & Answers

    What are the average payment terms offered by Chinese companies?
    The average payment terms offered by companies in mainland China are 81 days.

    How does China’s rate of customer defaults compare to the regional APAC average?
    Chinese companies reported fewer customer defaults than their regional counterparts, with only 16% experiencing at least one default in the past 12 months, in contrast to the APAC average of 45%.

    What is the financial impact when customers default?
    When customers default, the financial impact is more significant in China. Defaulted receivables made up 11.2% of total accounts receivable among Chinese suppliers, compared to 10% across APAC. This effect was particularly noticeable in the wood and chemicals industries, where about 20% of receivables were written off as defaults.

  • US Dollar Ascends Versus Vietnamese Dong Amid Market Stability

    US Dollar Ascends Versus Vietnamese Dong Amid Market Stability

    The U.S. dollar experienced a slight increase against the Vietnamese dong early Friday, while maintaining a stable position against other major global currencies. The uptick saw the dollar traded at VND26,270 by Vietcombank, reflecting a 0.08% rise from the previous day. Concurrently, on the unregulated market, the dollar exchanged hands at approximately VND25,990.

    Vietnam’s Monetary Policy

    The State Bank of Vietnam has responded to these market dynamics by reducing its reference rate by 0.02% to VND25,561. This move is part of its monetary policy to moderate the impact of global economic influences on the local currency.

    In the international arena, the currency market has been relatively stable this week. The U.S. dollar has found support in the backdrop of escalating oil prices and increasing tensions in the Middle East. However, this has been counterbalanced by placid U.S. employment and inflation reports, which have lowered projections for hikes in the U.S. interest rate.

    Global Currency Trends

    Within the week, the euro experienced a slight decrease of 0.2%, taking its value to $1.1536, while the British pound remained static at $1.3489. Meanwhile, the Australian dollar traded consistently at $0.7060.

    The Japanese yen lingered at 159.36 per U.S. dollar, hovering near the crucial 160 level. This critical threshold, according to traders, could prompt another round of yen buying from Tokyo. This comes following a joint intervention by Tokyo and the U.S. last month, which failed to stabilize the weakening currency. The yen has since lost approximately 50% of the gains it initially made following the intervention, declining about 1% this week to 159.43 per dollar.

    South Korea’s won, which had also benefited from official intervention as authorities sold dollars in unison with Japan last month, has remained steadier than the yen. Despite this, the won is predicted to register a marginal loss of 0.6% against the dollar this week.

    Questions & Answers

    What was the trading value of the U.S. dollar against the Vietnamese dong on Friday?
    The U.S. dollar was traded at VND26,270 by Vietcombank on Friday.

    What impact did the State Bank of Vietnam’s reduction in its reference rate have on the market?
    The reduction in the reference rate aimed to moderate the impact of global economic influences on the local currency.

    What has been the performance of the yen and the won in the currency market this week?
    The yen has lost about 1% this week moving to 159.43 per dollar, while the won is predicted to register a marginal loss of 0.6% against the dollar.

  • Global Gold Prices Take a Tumble: A Weekly Analysis of Bullion Rates Amid Mild Inflation

    Global Gold Prices Take a Tumble: A Weekly Analysis of Bullion Rates Amid Mild Inflation

    The price of Vietnam’s gold bars saw a dip on Friday morning, mirroring the global trend of falling bullion rates. Saigon Jewelry Company, a significant player in the local gold market, recorded a 0.69% drop in its gold bar prices, slipping to VND143.3 million (US$5,490.21) per tael. The decline reflects a 0.49% decrease for the week.

    Despite the dip, local gold prices in Vietnam remain approximately VND6.3 million per tael higher than the global rates. The price of gold rings also fell on Friday, with a decrease of 0.7% to VND142.8 million per tael. For reference, a tael is equivalent to 37.5 grams or 1.2 ounces.

    Global Gold Market Trends

    Global gold prices experienced a slight decrease on Friday, indicating an overall weekly loss. This follows recent profit-taking by investors after U.S. inflation data spurred bullion to reach its highest level in over two months, subsequently weakening the argument for an imminent Federal Reserve rate hike.

    Spot gold saw a decrease of 0.5%, standing at $4,326.75 per ounce. Despite reaching its highest point since June 5 on Thursday, gold ended the day 1.3% lower, putting it on track for a weekly loss.

    U.S. gold futures due for delivery in December slid nearly 1% to $4,382.50. The non-yielding metal received a boost following an unexpected drop in U.S. July nonfarm payrolls last week, which, coupled with softer inflation data this week, significantly reduced the expectations of a rate hike in the coming month.

    The Future of Gold Trading

    Market observers believe that the profit-taking phase in the gold market is likely the result of episodic and speculative capital at play. Despite the recent dips, some suggest that gold may be setting up for a significant rally.

    The potential catalyst for this rally is not immediately apparent, but it could occur if gold prices breach the $4,400 barrier. If that happens, reaching $5,000 by the end of the year is seen as a feasible expectation, signalling potential profitability for gold investors and traders alike.

    Questions & Answers

    Why did gold bar prices in Vietnam fall this week?
    The prices fell due to a combination of global trends and local market dynamics. Gold prices globally have been on a downward trend, and this has influenced the Vietnamese market.

    How does the U.S. inflation data impact the global gold prices?
    U.S. inflation data is a significant indicator of economic health and can impact Federal Reserve’s decisions on interest rates. This, in turn, influences gold prices, as higher interest rates usually decrease the demand for gold, leading to lower prices.

    What could be the potential catalyst for a significant rally in gold prices?
    A potential catalyst for a major rally in gold prices could be the breach of the $4,400 per ounce mark. If this level is surpassed, it could trigger increased buying activity, pushing prices towards the $5,000 mark by the year’s end.

  • Transforming Ishikari into Japan’s Prime Data Center Hub: NTT and Allies Lead the Charge

    Transforming Ishikari into Japan’s Prime Data Center Hub: NTT and Allies Lead the Charge

    NTT East Corporation has entered into a partnership with a collection of data center, telecommunications, energy, and infrastructure businesses, with the aim of transforming Ishikari City in Hokkaido into a major data center hub.

    Building a Data Center Cluster

    The newly formed Ishikari Data Center Consortium will concentrate its efforts on enhancing the necessary infrastructure to facilitate data center development. This includes the improvement of power and telecommunications networks. In addition, working in collaboration with local government, the consortium will put in place incentives and other schemes to encourage further growth.

    The consortium comprises several industry-leading companies, such as Sakura Internet, Kyocera, Tokyu Land Corporation, Ishikari Renewable Energy Data Center No. 1 LLC, Flower Communications, Broadband Tower Inc., NTT ME Corporation, Ishikari Regional Energy LLC, Liene Inc., and Hokkaido Integrated Communications Network Co., Ltd.

    Ishikari, situated in Hokkaido’s Ishikari Subprefecture, is rapidly becoming a favored location for data centers. Thanks to the Ishikari Bay New Port area, the city has access to renewable energy sources and is relatively safe from natural disasters. The consortium’s goal is to boost Ishikari’s profile as a key domestic data center site and one of Japan’s premier data center clusters.

    NTT East has announced that the consortium will strive to ensure that local residents and businesses reap the societal benefits of data center development, while simultaneously boosting Ishikari’s national reputation as a data center cluster.

    Previous Data Center Developments

    Since 2011, Sakura Internet has been operating its data center in Ishikari. The company has since expanded the facility and has been deploying GPUs there. Meanwhile, Tokyu Land, Flower Communications, and Broadband Tower joined forces on a 15-MW data center project in Ishikari in 2024, which is set to launch in 2026.

    These ventures have added to Hokkaido’s data center landscape. Data Center Map currently lists nine data centers on the island, primarily positioned around Sapporo. Several major operators have data centers in Hokkaido, including SoftBank, Kyocera, HotNet, Sakura Internet, KDDI, and Rakuten.

    NTT East provides services from roughly 30 data center locations in Japan. These include facilities in Tokyo, Yokohama, Chiba, Saitama, Ibaraki, Tochigi, and Gunma.

    Questions & Answers

    What is the aim of the Ishikari Data Center Consortium?
    The consortium’s goal is to enhance the necessary infrastructure for data center development in Ishikari City, working with local government to put in place incentives that encourage growth in order to establish the city as a major data center hub in Japan.

    Who are the members of the Ishikari Data Center Consortium?
    The consortium is composed of several companies, including NTT East Corporation, Sakura Internet, Kyocera, Tokyu Land Corporation, Ishikari Renewable Energy Data Center No. 1 LLC, Flower Communications, Broadband Tower Inc., NTT ME Corporation, Ishikari Regional Energy LLC, Liene Inc., and Hokkaido Integrated Communications Network Co., Ltd.

    What makes Ishikari City an attractive location for data centers?
    Ishikari City has access to renewable energy sources and is relatively safe from natural disasters. Furthermore, with the support from the consortium, the city is developing the necessary infrastructure to facilitate data center operations.

  • AI Revolution Fuels Unprecedented Growth in Data Center Infrastructure Market

    AI Revolution Fuels Unprecedented Growth in Data Center Infrastructure Market

    As the race to deploy artificial intelligence (AI) intensifies, businesses are investing not just in servers but also in electrical distribution, thermal management, liquid cooling, racks, and containment systems. These components form the pivotal infrastructure of AI-ready data centers, designed to handle power-intensive computing environments.

    This trend is reflected in the recent surge in the global data center physical infrastructure (DCPI) market, which hit a revenue of $12 billion during the first quarter of 2026, marking a 28% year-on-year growth. This follows five consecutive quarters of over 20% market growth, highlighting the continued investment in power and cooling infrastructures to meet the high demand for AI.

    AI Infrastructure: A New Race Begins

    The infrastructure required for AI differs significantly from previous cloud expansions. It demands significantly greater investments in power distribution, thermal management, cooling technologies, and facility engineering. Infrastructure spending per data hall is also increasing due to the need for higher rack densities, larger GPU clusters, and more electricity.

    Major tech companies including Microsoft, Google, Amazon Web Services (AWS), Oracle, and Meta have announced substantial investments in AI infrastructure in the past two years. These initiatives include AI-optimized data centers, extended cloud regions, and dedicated GPU infrastructure to meet the growing enterprise demand for AI applications.

    NVIDIA has popularized the concept of “AI factories”; large-scale computing environments optimized for AI training and inference, where components like computing, networking, storage, power, and cooling are integrated. This concept reflects the industry-wide shift towards facilities specifically constructed for AI workloads.

    AI model training and inference require densely packed GPU clusters operating at high utilization, placing unprecedented demands on electrical systems and cooling infrastructure. In light of this, operators are rethinking traditional data center architecture.

    Power Infrastructure Moves to the Center Stage

    Thermal management grew nearly 50% year over year in the first quarter of 2026. With AI deployments driving higher rack power densities, there is an increasing demand for advanced cooling technologies such as direct liquid cooling (DLC) to maintain performance and operational efficiency.

    As rack densities increase, conventional air cooling is becoming less practical for many high-performance AI deployments. Hence, hyperscale cloud providers are increasingly deploying liquid-cooling technologies for AI infrastructure.

    Access to power is becoming increasingly critical to where new AI facilities are constructed. Grid constraints, permitting timelines, and utility capacity are now key considerations for developers. This trend is driving greater investment in electrical infrastructure, including modular power systems, intelligent energy management platforms, and grid-resilient backup solutions.

    Reflecting evolving market requirements, heat rejection has emerged as a newly tracked segment within the DCPI market, contributing approximately $1 billion to its market measurement. This shift in data center design is leading operators to integrate thermal management into the overall facility architecture to improve efficiency, reliability, and long-term scalability.

    Questions & Answers

    What is driving the increased investment in AI infrastructure?

    Increased use of AI applications is driving the need for more robust and efficient data centers to support these power-intensive operations. This is leading to significant investments in components such as power distribution, thermal management, cooling technologies, and facility engineering.

    How are major tech companies responding to the demand for advanced AI infrastructure?

    Major tech companies, including Microsoft, Google, Amazon Web Services, Oracle, and Meta, have announced significant investments in AI-optimized data centers, extended cloud regions, and dedicated GPU infrastructure.

    How is the design of data centers evolving to meet the demands of AI?

    Operators are rethinking traditional data center architecture to accommodate densely packed GPU clusters that operate at high utilization. They are also increasingly integrating thermal management into the overall facility architecture, reflecting the growing importance of energy-efficient infrastructure.

  • How Low MOQ and Mixed Pallet Loading Are Helping Small Retailers Compete in Global Markets

    How Low MOQ and Mixed Pallet Loading Are Helping Small Retailers Compete in Global Markets

    Small and mid-size retailers don’t lose to big chains because they lack ambition. They lose on the unsexy stuff: supplier minimums, container utilisation, inventory tied up in the wrong colours, and warehouses clogged with “maybe it’ll sell” cartons. That’s the real battlefield.

    This is why low-MOQ supply and mixed pallet loading are getting so much attention right now, and why operators like OKDExports are becoming useful partners for retailers who need breadth without the burden. It’s not a trend. It’s a practical response to how modern retail actually works.

    The old model: buy big or don’t buy at all

    Traditional global sourcing tends to push retailers into extremes. Either commit to full cases and full pallets per SKU, or accept that the factory won’t bother. That’s fine when the buyer has a national footprint and a distribution network that can absorb volume.

    For everyone else, high MOQs create a chain reaction:

    • cash flow gets trapped in slow-moving stock
    • assortment decisions become conservative and repetitive
    • new product trials turn into expensive gambles
    • markdowns and “clearance weeks” become part of the calendar

    And here’s the kicker: the risk lands with the retailer, not the supplier. So retailers start behaving like wholesalers, ordering deep and hoping demand catches up. It’s backwards.

    Low MOQ: the simplest fix with the biggest ripple effects

    Low MOQ purchasing flips the commitment level. Instead of over-ordering to access global supply, retailers can test and scale based on sell-through.

    What changes when MOQ drops?

    • product testing becomes normal instead of rare
    • seasonal buying gets sharper, less speculative
    • niche lines can exist without becoming dead stock
    • the buyer can respond to demand signals faster

    It’s not just about smaller orders. It’s about shorter decision cycles. Retail has moved toward quicker assortment refreshes and tighter OTB discipline, and low MOQ fits that reality.

    Still, low MOQ on its own can create a new problem: too many small shipments. That’s where mixed pallet loading earns its place.

    Mixed pallet loading: the logistics tool that makes low MOQ actually work

    Mixed pallet loading is the operational bridge between “small quantities” and “efficient shipping.” It allows multiple SKUs, and often multiple product types, to be built into a single palletised load while keeping the paperwork and handling clean.

    For small and mid-size retailers, mixed pallets solve several headaches at once:

    • more SKUs per shipment without bloated volume per SKU
    • better cube utilisation across assorted lines
    • fewer inbound events compared to lots of tiny consignments
    • smoother replenishment planning across multiple categories

    This is what makes it possible to stock variety like a larger retailer, without having a warehouse the size of a sports stadium.

    Competing globally is really about competing on assortment

    Big players win on price and reach. Smaller players often win on taste, curation, and speed. But curation only works if sourcing isn’t forcing bulk commitments.

    Mixed pallets support modern merchandising in a very direct way:

    • fast-moving staples can be replenished alongside slower “range builders”
    • promotions can be supported without ordering a full pallet of one item
    • regional preferences can be tested without a huge financial bet
    • new SKUs can be introduced, measured, and either scaled or dropped quickly

    It’s the closest thing retail has to agile development. Try, learn, adjust. Why should sourcing be stuck in 2009?

    The hidden operational win: cleaner receiving and fewer internal fights

    Mixed pallets can be a dream or a nightmare. The difference is process. Retail operations teams hate “surprises” more than anything else, and badly built mixed pallets are basically surprise machines.

    Done properly, mixed pallet programs reduce friction inside the retailer’s business because they bring structure:

    • clear carton marking standards
    • pallet IDs that match documentation
    • SKU-level packing lists that reconcile quickly
    • predictable inbound handling (less rework at goods-in)

    That last part matters. In many small retail operations, one messy inbound can disrupt everything: putaway, picking, store replenishment, even customer delivery timelines.

    What makes mixed pallets operationally reliable

    Retailers considering this approach should look past the headline promise and ask a few very practical questions. These separate “yes we can” from “yes we do this every week.”

    Documentation that matches physical reality

    Mixed pallets live and die by accuracy. A packing list that lumps items into vague categories is useless at receiving. The standard should be:

    • SKU-level detail
    • correct carton counts per SKU
    • dimensions and weights that are verified, not copied from old templates
    • pallet-level breakdown so receiving doesn’t become a guessing game

    Labelling that warehouse teams can work with

    Carton labels should include enough information to be scanned, counted, and reconciled quickly. If the inbound team can’t identify what’s in a carton without opening it, time gets wasted immediately.

    Packaging that survives more touchpoints

    Mixed pallet handling often means more movement: picking, staging, palletising, wrapping, loading, unloading, receiving. Weak cartons and sloppy inner packing lead to damage claims and shrinkage. Good mixed pallet operators take packaging discipline seriously because it’s cheaper than fixing problems later.

    Why low MOQ matters more now than ever

    Retail has become less predictable. Demand spikes faster, social trends move quicker, and customer tolerance for “out of stock” is low. Meanwhile, nobody wants capital sitting in a warehouse like it’s a museum.

    Low MOQ and mixed pallet loading allow small retailers to run leaner without becoming boring. That’s the competitive edge: not having the cheapest unit cost, but having the right products available at the right time with fewer painful overstocks.

    Also, it makes international sourcing less intimidating. When buyers can start small and build confidence through repeatable shipments, global procurement becomes a routine, not a risk.

    How OKDExports fits into the small-retailer playbook

    The appeal of OKDExports in this context is straightforward: helping retailers access low MOQ purchasing and mixed pallet loading options so they can build variety without overcommitting. That matters most for businesses that need range and flexibility but don’t have the scale to justify full pallets per SKU.

    From a retail operations perspective, this kind of support is useful because it aligns sourcing with how small retailers actually trade:

    • smaller, more frequent range updates
    • testing and scaling rather than bulk buying
    • replenishment driven by sell-through, not supplier minimums
    • shipments built around assortment, not single-product volume

    It’s not glamorous, but it’s exactly how smaller operators stay competitive when they’re up against businesses with far bigger buying power.

    Practical tips for retailers adopting low MOQ and mixed pallets

    A few habits make this model run smoother from day one:

    • standardise SKU naming and carton marks across teams
      Merchandising and warehouse systems need to speak the same language.
    • require pallet-level packing information
      Receiving teams should know what’s on a pallet before the wrap comes off.
    • plan inbound capacity
      Mixed pallets can increase SKU touches at goods-in, even when shipment volume is smaller.
    • track sell-through tightly
      Low MOQ is wasted if replenishment decisions aren’t backed by clear movement data.

    The bottom line: flexibility is the new scale

    Small retailers can’t out-volume big chains. But they can out-move them. Low MOQ and mixed pallet loading enable that mobility by reducing commitment, improving assortment control, and making global sourcing feel manageable.

    In a market where trends are fast and inventory mistakes are expensive, that’s not a nice extra. It’s a competitive system.