Tag: report

  • Indonesia Posts 670m Trade Deficit January highest since april 2014

    Indonesia Posts 670m Trade Deficit January highest since april 2014

    Indonesia posted a $670 million trade deficit in January as increased exports were offset by higher imports of raw materials by manufacturers, the Central Statistics Agency, or BPS, reported on Thursday (15/02).

    The deficit is the highest since April 2014, having increased from December’s $220 million deficit, which was revised down from $270 million. Indonesia only posted trade deficits in July and December last year.

    Exports increased 7.86 percent year on year in January to $14.46 billion, compared with 6.93 percent year on year in December, thanks to mining and manufactured goods. This figure however, is down 2.81 percent from December.

    According to BPS head Suhariyanto, prices of some commodities, such as copra and palm kernel oil, have declined, undermining export gains from rising coal and nickel prices.

    Imports jumped 26.44 percent year on year in January to $15.13 billion, compared with 17.83 percent year on year in December, due to purchases of electrical and mechanical machinery. This figure is 0.26 percent higher than in December.

    The imports of raw materials increased 2.34 percent in January, compared with a month earlier, while imports of consumer and capital goods declined by 1.46 percent and 7.39 percent, respectively.

    However, the imports of consumer goods, capital goods and raw materials showed double-digit growth on an annual basis, at 32.98 percent, 30.9 percent and 24.76 percent, respectively.

    Indonesia had its biggest trade deficits with China ($1.83 billion), Thailand ($211.4 million) and Australia ($178.2 million).

  • Lotte Shopping swings to loss in 2017 due to THAAD row

    Lotte Shopping swings to loss in 2017 due to THAAD row

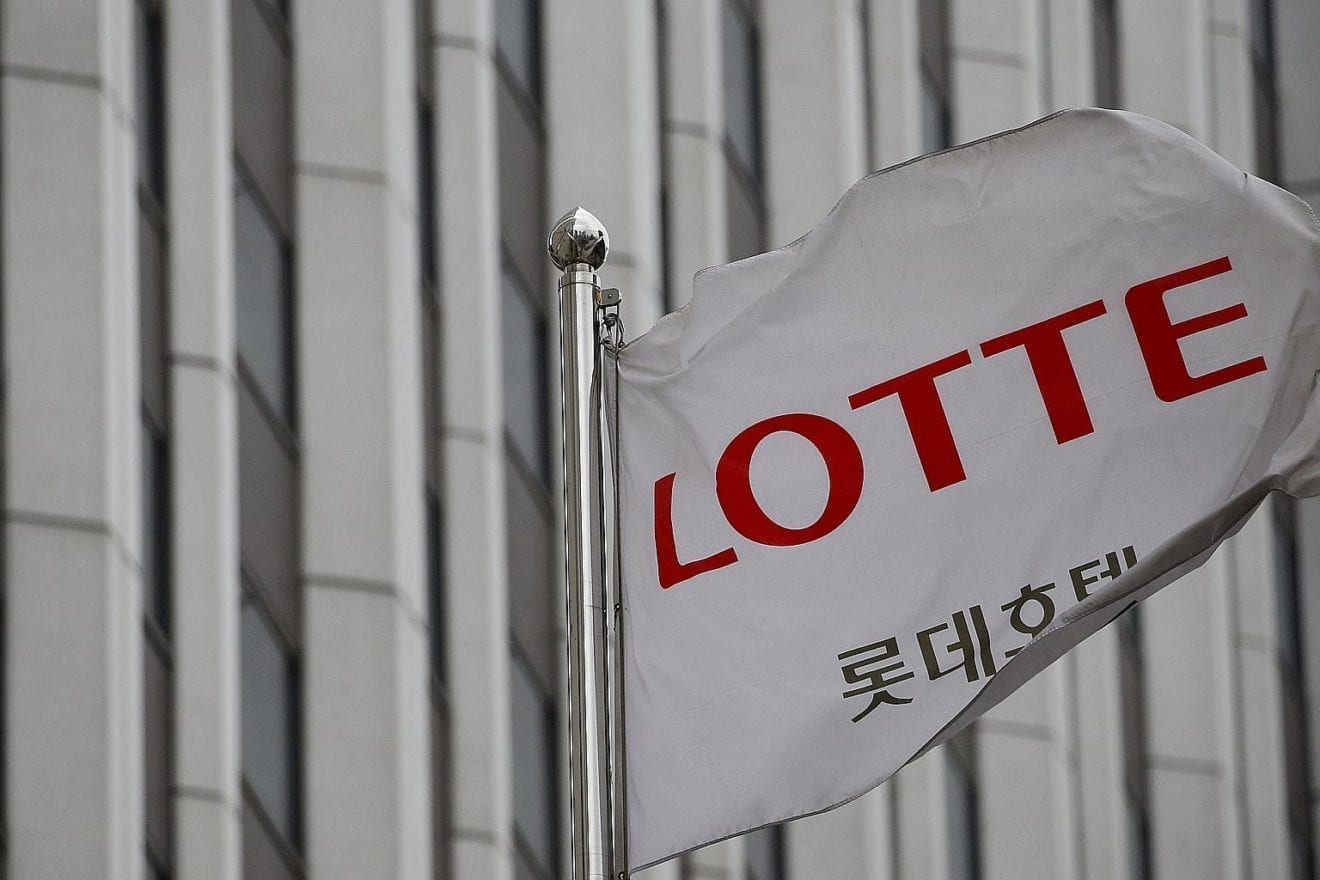
    Lotte Shopping Co., the retail affiliate of South Korea’s fifth-largest conglomerate Lotte Group, said Thursday it swung to the red in 2017 from a year earlier amid a diplomatic row between Seoul and Beijing over the deployment of a U.S. anti-missile system here.

    Its losses reached 20.6 billion won (US$18.9 million) on a consolidated basis last year, compared to a net profit of 246.9 billion won posted in 2016, the company said in a regulatory filing. The firm operates Lotte’s key retail units, including its department store and hypermarket chains.

    Operating income stood at 530.3 billion won, down 30.5 percent on-year, and sales dropped 24.6 percent to 18.2 trillion won during the cited period, it said.

    The numbers reflect the performance of Lotte Shopping and its subsidiaries, including Lotte HiMart Co., which specializes in electronics and home appliances.

    The drop in the revenue was largely expected following Beijing’s apparent retaliation over Seoul’s deployment of the U.S. Terminal High Altitude Area Defense (THAAD) system on its soil. Lotte Shopping was one of the most affected companies from the economic retaliation after it signed a land-swap deal with the Seoul government to host the missile shield system.

    Shares of Lotte Shopping soared 4.17 percent to close at 250,000 won on the main bourse Thursday, with the broader KOSPI index gaining 0.46 percent. The earnings results were released after the stock market closed.


  • Ericsson rings up huge losses in 2017

    Ericsson rings up huge losses in 2017

    Swedish telecoms giant Ericsson said Wednesday that it rang up huge losses last year as network competition, restructuring costs and investment in lightning-fast 5G technology pushed it deeply into the red.

    The news sent Ericsson’s share price tumbling nearly nine percent on the Stockholm stock exchange in early trading, in a flat market.

    Ericsson said in a statement it booked net loss of 35.1 billion kronor (3.6 billion euros, US$4.4 billion) in 2017, compared with profit of 1.9 billion kronor the year before.

    The group also booked an underlying or operating loss of 38.1 billion kronor last year after profit of 6.3 billion kronor in 2016, while revenues dropped by 10% to 201.3 billion kronor, the statement said.

    “The focus during 2017 has been on reshaping overall strategy and on improving company structure and performance,” explained chief executive Borje Ekholm.

    “2017 was also the year when 5G went from vision to real business opportunities while we at the same time had good traction for our 4G portfolio,” he continued.

    “We are fully committed to our plans and our targets and expect to see tangible results of our turnaround in 2018.”

    Below target

    In the fourth quarter alone, Ericsson’s net loss widened to 18.9 billion kronor from a loss of 1.6 billion kronor a year earlier, while sales slumped by 12% to 57.2 billion kronor.

    “The fourth quarter was in line with our overall expectation, with gradual improving performance in networks and continued significant losses in digital services. The result is however far below our long-term ambition,” CEO Ekholm said.

    Earlier this month, Ericsson had announced that writedowns of 14.2 billion kronor would be booked in the fourth quarter, originating mainly from goodwill from investments made a decade ago.

    Investors fled after the earnings report was published.

    “When I look at the order book there’s not a lot of meat on the bone in there … I’m surprised the (share price) fall is so steep, but it’s an automated-traded share,” Jonas Olavi of Alfred Berg investment bank said.

    “Ericsson needs to turn over every rock in the search for new sources of income,” Mikael Tornwall, telecoms expert for daily Svenska Dagbladet, said.

    Ericsson said it had reduced the number of its employees and external workforce by 10,000 during the fourth quarter, part of its restructuring plan aimed at cost savings of 10 billion kronor by mid-2018.

  • TAS Offshore posts RM1.56 million net loss in Q2

    TAS Offshore posts RM1.56 million net loss in Q2

    Shipbuilding firm TAS Offshore Bhd swung to the red registering a net loss of RM1.56 million for the second quarter ended November 30, 2017 against a net profit of RM489,000 in the previous corresponding period, due to unrealised forex losses as a result of the strengthening ringgit.

    Revenue however, jumped three times from RM2.92 million to RM11.71 million on progressive revenue recognition on shipbuilding contracts.

    TAS Offshore told Bursa Malaysia that despite signs of demand and supply finally finding a balance, the group will be cautious in its operation since the market is still uncertain due to the US shale oil industry.

    “However, in the long term, we envisage the oil price outlook to be positive due to the increase in demand for energy when industrial and development activities increase in tandem with the population growth and the demand for offshore support vessels will return.”

    For the first half of the year, TAS Offshore, however, reported a net profit of RM673,000 versus a net loss of RM642,000 in the same period a year ago, while revenue leaped over three fold from RM5.17 million to RM22.14 million.

    The stock closed unchanged 33.5 sen with some 147,000 shares changing hands.

  • Retailers suffer worst December since 2010

    Retailers suffer worst December since 2010

    Retail sales fell more sharply than expected in the core Christmas month, capping the worst December performance for volumes since 2010.

    The Office for National Statistics (ONS) issued the grim update on the health of the high street just hours after Carpetright became the latest big name chain to announce a profit warning .

    The retail figures showed sales volumes fell 1.5% on November which was boosted by strong Black Friday trade.

    It marked the biggest month-on-month fall since June 2016 – the month when the UK was focused on the Brexit vote on 23 June.

    The Leave win prompted a collapse in the value of the pound, resulting in a leap in shop prices during 2017 as a whole as stores passed on higher import costs.

    Higher inflation, coupled with earnings failing to keep pace, has been a thorn in the side of the retail sector as the squeeze on shoppers’ budgets has dented demand for non-essential goods.

    The ONS said 2017 was the weakest year for retail since 2013 but it still recorded year-on-year growth of 1.3% and a rise of 1% over the final quarter of the year.

     How the major retailers have fared over Christmas

    Senior statistician, Rhian Murphy, said: “Retail sales continued to grow in the last three months of the year partly due to Black Friday deals boosting spending.

    “Consumers continue to move Christmas purchases earlier with higher spending in November and lower spending in December than seen in previous years.

    “However, the longer-term picture is one of slowing growth, with increased prices squeezing people’s spending.

    “Over the year the proportion of internet spending is continuing to rise, with almost one in every five pounds spent online by the end of 2017.”

    Ruth Gregory, UK economist at Capital Economics, said it was difficult to get a clear picture of the state of the high street because the ONS figures showed retail sales values rising – suggesting a limited impact from price pressures.

    “A fall in retail sales volumes in December had always looked likely, given November’s hefty rise.

    “After all, UK retailers’ adoption of “Black Friday” discounting appears to have caused consumers to bring forward their Christmas purchases, rather than to buy more overall in recent years,” she wrote.

  • China’s biggest retail owner posted declining revenue, again

    China’s biggest retail owner posted declining revenue, again

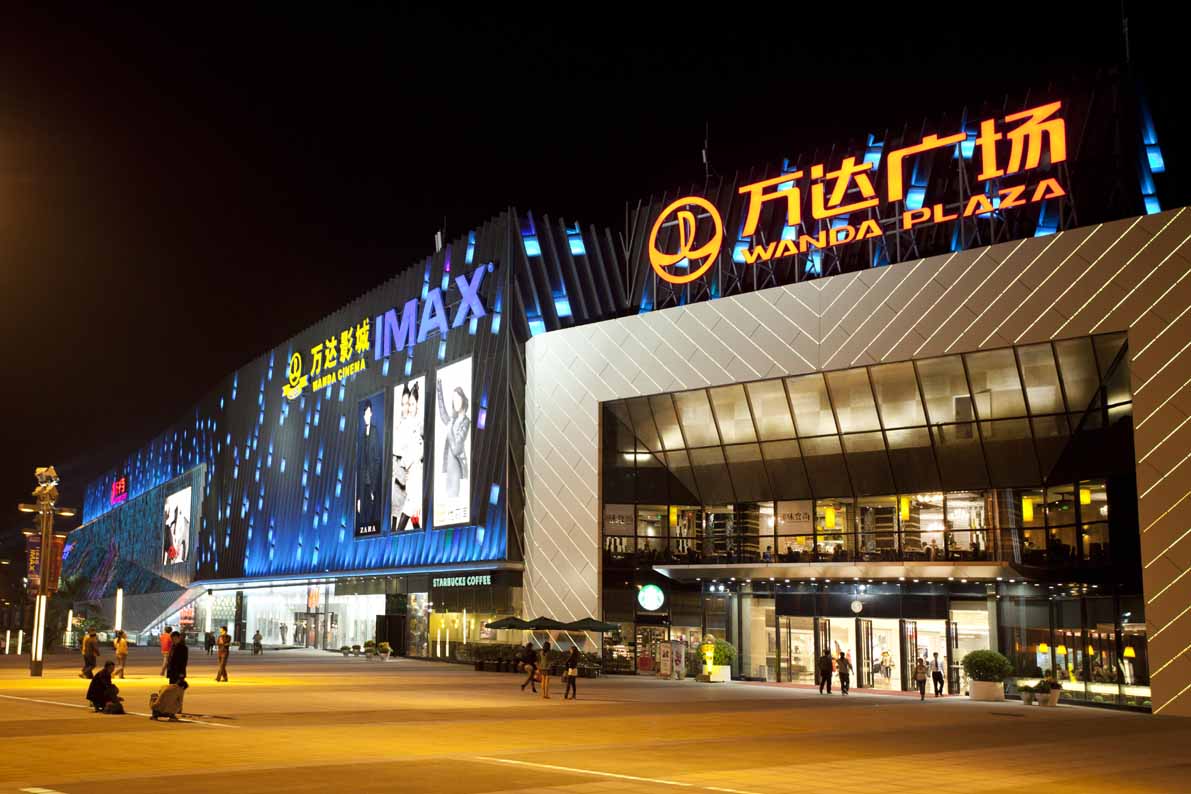
    Dalian Wanda Group, the largest mall owner in China, posted a 10.8 percent decline in revenue for 2017 — making it the second year in a row the retailer reported a drop.

    Wanda explained its performance of only about $35 billion in revenue as being due to selling off its cultural and tourism holdings, reported the Wall Street Journal. The company’s cultural assets account for 28 percent of its overall revenue, or nearly $11 billion.

    Analysts say Wanda’s retail portfolio is not the cause of its reported revenue decline.

    “Wanda is doing quite well in its shopping malls, from their rental-income growth and high occupancy rate,” S&P Global Ratings’ Dennis Lee told the Journal. Income derived from rents increased 30 percent this year for the company.

    In its report, Wanda also noted for the first time that 93 percent of its holdings are located in China. The information — never previously disclosed, according to the Journal — may be in response to the pressure the company faced last year amid the Chinese government’s crackdown on capital outflows to sell off its overseas real estate and other holdings.

    Last fall, Wanda was selling five foreign developments, including One Beverly Hills, a $1.2 billion condo and hotel project, while in July it sold of $9.4 billion worth of its hotel portfolio.

    In 2016, Wanda’s decline in revenue was explained by a drop in residential markets.

  • Isobar Launches ‘Augmented Humanity: Isobar Trends Report 2018’

    Isobar Launches ‘Augmented Humanity: Isobar Trends Report 2018’

    Isobar, a leading global digital agency, predicts that 2018 will be the year of Augmented Humanity, a year where technology enhances and scales our most human attributes. In 2018, technological interfaces will become more natural and instinctive, technology will automate repetitive tasks to free up time for creativity and compassion, and artificial intelligence will meet emotional intelligence. This is further detailed in ‘Augmented Humanity, Isobar Trends Report 2018’.

    Isobar’s innovation and strategy experts from around the world have defined five key trends that explore this evolving relationship between humanity and technology and predict a harmonious future. Augmented Humanity explores the ways in which technology enhances and fuels our most human attributes – the ability to recognise and trust each other, to adapt to changing circumstances and the power to deliver true creativity.

    Jean Lin, Isobar’s Global CEO, comments: “Artificial intelligence is great, but humans score on emotional intelligence. The power of being human is in empathy. This cannot be automated or outsourced. Augmented Humanity will use technology to scale everything that is best and most powerful about human interaction.”

    The report argues that we may one day view the era of anonymous, one size fits all transactions as a temporary blip in our evolution, and that as technology advances it will become more human, not less. It will return us to a time where voice will be the primary way we interact with the world, where we will be recognised and rewarded in stores, and where we will buy more directly from trusted suppliers.

    Isobar’s five key trends for 2018 explore this intersection of technology and humanity, magic and the machine, code and conscience:

    1. Body Talk explores the body as an interface, as our eyes and ears replace touching and tapping.
    2. Powered by People tackles the shift from customers to communities as technology turbocharges the sharing economy.
    3. The Economy of Me looks at the power of AI to deliver ever more personalised products, prices and places.
    4. The Ethical Algorithm tackles technology as a force for good; in a world of fake news and algorithm bias is there such a thing as moral code?
    5. The Makers and the Machines explores the extraordinary union of art and technology to create outputs we could never before imagine.


    Within each theme, Isobar unpicks key sub trends and explores how they come to life today, in the future, and what they mean for businesses and brands right now. The report celebrates the importance of emotion at every touchpoint; in this new landscape it will no longer be enough for technologists to ask “how does it work?” – they need to consider human emotion and drivers and ask “how does it feel?”.

  • Singapore Myanmar Investco reports encouraging initial retail results at Yangon International

    Singapore Myanmar Investco reports encouraging initial retail results at Yangon International

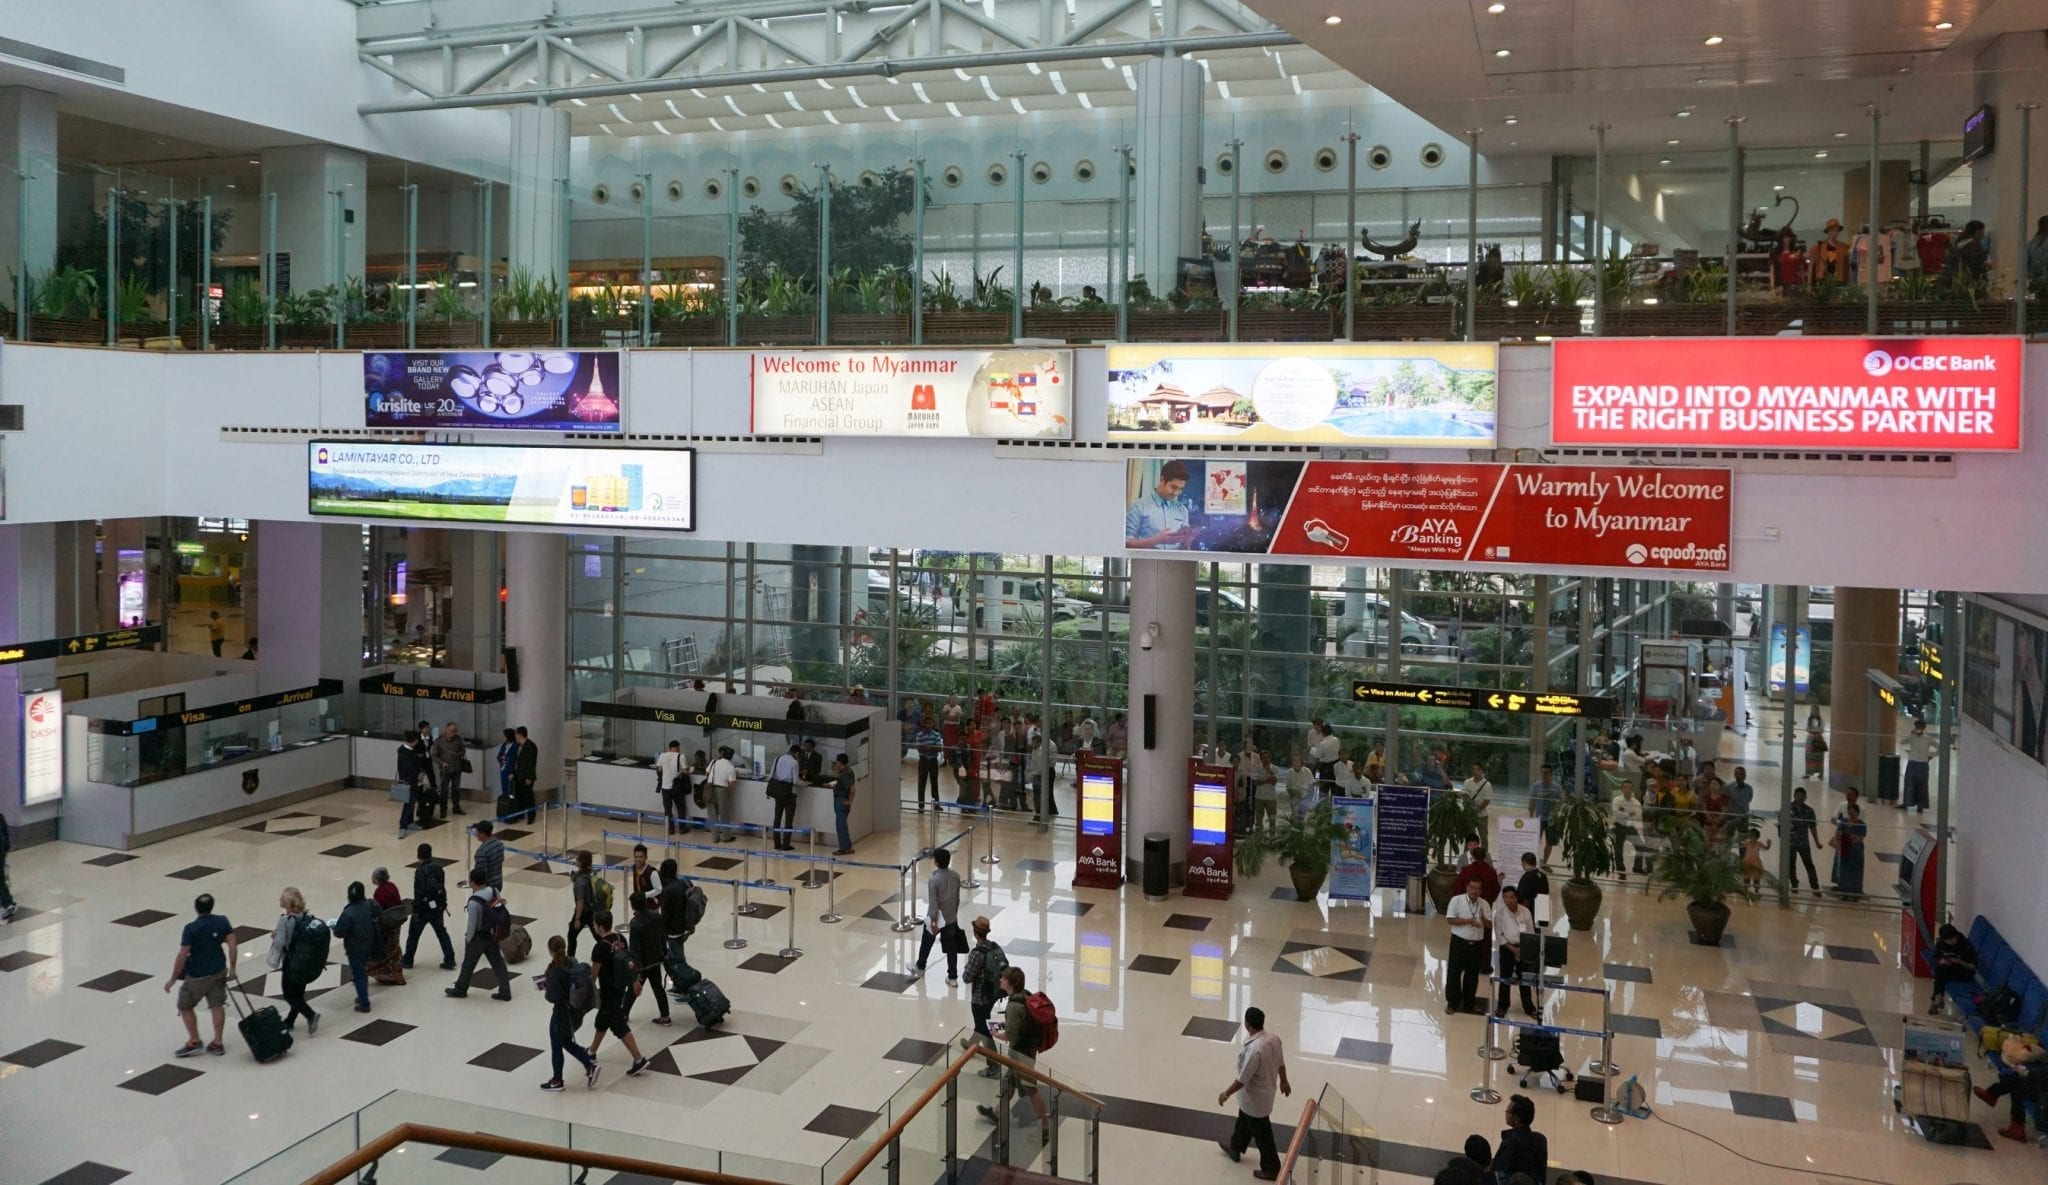
    Singapore Myanmar Investco Limited has reported revenue of US$13.3 million in its travel and fashion retail segment for the year ended 31 March 2017.

    Subsidiary SMI Retail only began duty free operations at Yangon International Airport in September 2016, meaning there is little meaningful basis for year-on-year comparison. The company was awarded contracts for duty free, other retail and food & beverage outlets in 6,700sq m of space at the airport’s new International Terminal in December 2015.

    The 6,700sq m of retail space includes a multibrand and multicategory duty free area of almost 2,000sq m on three levels

    Singapore Myanmar Investco Limited reported overall group revenue of US$23.3 million for the year, and a gross profit of US$4.8 million. Net of tax, the company reported a loss of US$7.3 million.

    “The initial results of retail operations at Yangon International Airport are encouraging although it will take time for the new terminal to reach traffic flows at projected levels,” said SMI President and CEO Mark Bedingham in the company’s annual report.

    “We have received much positive feedback from passengers and the airport management company on the quality of the duty free and travel retail stores that we have created and this initial success has been widely noticed in the city itself.

    “Notably, we have used our relationship with DFS to supply a comprehensive portfolio of international wines & spirits and beauty brands for both departures and arrivals at Yangon International Airport and have introduced more than 30 international fashion and lifestyle brands to create an outstanding retail experience for this very modern, newly-built terminal.

    “This new terminal has dramatically increased the capacity of Yangon International Airport to meet the expected rapid rise in international travellers; for business, for tourism and for Myanmar nationals who are also starting to travel overseas in greater numbers. This new terminal is already scheduled for further expansion and this will undoubtedly create new opportunities for SMI in travel retail at the airport.”

    Bedingham also noted that a number of mall owners and developers in Myanmar saw SMI as a “highly desirable partner”. He continued: “We have been pleased to work with Junction City – a new integrated upscale development in downtown Yangon. We have been able to introduce several international brands that we work with at the airport into Junction City and nearly all of these retail stores have been opened by the end of April 2017.”

    SMI signed an exclusive distribution agreement with Shiseido Asia Pacific in February 2017 and the first Shiseido flagship counter in Myanmar will open in Junction City by mid-year 2017.

    Non-Executive Chairman Ho Kwok Wai said that SMI would now move focus on organic growth across its diversified business portfolio.

    He noted a World Bank report issued on 30 January 2017 which stated that Myanmar’s economy will grow an average of +7.1% per year in the next three years.

    “The landscape in Myanmar was very different when we began our transformation in 2013 but our objective for the group remains the same: to build a diversified business model to capitalise on the strong trends in consumer spending, international tourism and infrastructure investment in this frontier market,” he said.

    “From the encouraging results shown in our portfolio of businesses so far, there is positive sentiment that we are on the cusp of major advances in Myanmar, with strong growth potential.”

  • The age of self service data

    The age of self service data

    A recent EY– Forbes Insights research report  clearly shows the value organisations get from the strategic use of data; the most mature respondents of its survey were found to be considerably more likely to enjoy growth in revenues and operating margins of 15% or more, along with significant improvement in their risk profile.  No wonder all areas of the business are looking to data to support their drive for modernisation and transformation.

    A challenge is that across the organisation there are many different requirements being placed on a company’s data – and until now access to analytics was reserved for either the data scientist or business users needed significant IT support, just to get a limited set of standardised set of reports run at set times.

    So how can an enterprise make sure all these demands are met with the right data at the right time and in the right format, giving each department and job function the ability to use data they need – in short, how can we facilitate the age of self service?

    Let’s take two examples of how requirements can differ, and why opening up an organisation’s data to self service should be a priority.

    It is often the Marketing department that is the first to harness data driven technologies and tools.  Those that are the most mature and comprehensive in their use of analytics, as compared to their peers, have been shown to gain a 56% greater return on marketing investments, and 10 times greater year on year increase in annual revenue. Common initiatives focus on seeking cross channel insights, better targeting of customers in real time with the next best offer, improved customer engagement and ultimately demonstrating how their actions contribute to the bottom-line.

    Other areas of the business are also turning to data for help; take HR, for example. Similar to Marketing, companies advanced in employing workforce analytics consistently outperform competition, increasing revenue per employee by up to 26% and being 2.5 times more likely to improve their leadership pipeline. They are looking for analytics to help them identify the employee skills and strengths that will help make an impact on business performance, understand workforce challenges, and better align people strategies with business strategies, so that they can more easily attract, nurture, and retain top talent.

    While the business roles, goals and use of data are different, there are common themes: the need to use multiple data sources, present data visually in a simple and easily understandable way, and demonstrate business impact. To deliver on these business goals, enterprises must empower staff to self service data so that they can be met without the need for expensive, time consuming and sometimes restrictive technical or IT support.

    What does this mean in terms of how data should be handled and distributed in an organisation? How can the age of self service data be made a reality?

    A driving force for democratising data in the workplace is the cloud.  Making enterprise class analytics available to all and from anywhere, quickly and cost-effectively, it is also bringing new and powerful visualisation technologies into the hands of the business user.

    Able to be deployed as a hybrid solution, new cloud-based analytics capabilities can be linked to data sources which can remain either in place, on-premises, in the cloud or a mixture of on-premises and the cloud, giving massive flexibility.  It helps organisations quickly and easily dip a toe in the water and test out the cloud or undertake a managed transition, thereby avoiding a “big bang” approach. Given that most companies have multiple legacy systems at different stages of their lifecycle, it enables them to gain maximum value from past investments.

    Gaining maximum value from these new investments is also key.  With cloud, it can be all too easy for the different departments to go out and buy in a SaaS solution.  This can lead to there being different solutions in place across the company that do not work together and as a result create new data silos.  As the true value of data is gained, when it can be pooled so that everyone can access it and unexpected correlations made, it is essential that IT has a part in the implementation of these new solutions. That way the entire organization’s analytics needs can be catered for and underpinned by a platform for success.

    The age of self service data is a business need today. The key is to look across the business at each job role or line of business and seek to understand their different requirements will evolve for the future, not just today. This approach will also lead IT to be an enabler for an organisation that maximises value from data in unique and impactful ways.

  • Vietnam’s retail market is promising, but there are pitfalls

    Vietnam’s retail market is promising, but there are pitfalls

    Family Mart has had losses in Vietnam, Thailand and Indonesia. Reuters quoted Koji Takayanag, president of FamilyMart UNY, which now owns the second largest convenience store chain in Japan, as saying that the chain has decided to stop injecting more money into Family Marts in Vietnam.

    According to Tri Thuc Tre, Parkson reported another loss of VND20 billion in Vietnam in the first quarter of the year, which means a total loss of VND50 billion in the last nine months of the fiscal year.

    Parkson Retail Asia has two subsidiaries in Vietnam – Parkson Hai Phong Co Ltd and Parkson Vietnam Company Ltd. The latter has two subsidiaries – Parson Vietnam Service Management Company Ltd and Parkson Hanoi Company Ltd.

    Parkson Hanoi which manages two buildings Parkson Keangnam and Parkson Viet Tower. Both shopping malls have shut down (the former in January 2015 and Viet Tower in mid-December 2016). Also in 2016, Parkson Paragon in HCMC also stopped operation.

    Though FamilyMart has taken a big loss, it will stay in Vietnam. While some retailers have left, others have arrived. Aeon Mall has announced the construction of a second mall in Hanoi.The Malaysian retailer’s fiscal year will end in three months, but analysts don’t think the business performance of the year will be satisfactory. Parkson’s managers have admitted that it is more and more difficult to do business in Vietnam as the market is getting more crowded.

    Other retailers have left, including Metro Cash & Carry, Best Carings, Wonderbuy, HomeOne and Sapomart.

    Meanwhile, market analysis firms, in their latest reports, say that Vietnam is a lucrative market.

    Phap Luat quoted Pham Thanh Cong from Nielsen Vietnam as saying that it is among the top three markets of investors.

    David Tan, CEO of Abeo Vietnam, said the Vietnamese retail market in 2016 was valued at $118 billion with the 10 percent growth rate. Of this, revenue from food service reached acrecord high of $41 billion.

    In fact, though the Vietnamese market is attractive, it has become ‘cramped’ with the presence of many retailers, both foreign and Vietnamese.

    According to Cong, there are 20 supermarket brands in Vietnam, while other countries have only five.

    A report of the Ministry of Industry and Trade shows that Vietnam has more than 700 supermarkets, 132 shopping malls and hundreds of convenience stores. By 2020, Vietnam is expected to have 1,200-1,500 supermarkets and 180 shopping malls, while traditional markets still exist.

  • Big data spend on pace to $57b in 2017

    Big data spend on pace to $57b in 2017

    Global spending on big data technology is expected to surpass $57 billion by the end of 2017, according to a new report from SNS Research.

    Despite challenges relating to privacy concerns and organizational resistance, big data investments continue to gain momentum throughout the globe, the report said.

    SNS Research estimates that big data investments will account for over $57 billion in 2017 alone. These investments are further expected to grow at a CAGR of approximately 10% over the next three years.

    Originally used as a term to describe datasets whose size is beyond the ability of traditional databases, the scope of big data has significantly expanded over the years.

    Big data not only refers to the data itself but also a set of technologies that capture, store, manage and analyze large and variable collections of data, to solve complex problems.

    Amid the proliferation of real-time data from sources such as mobile devices, web, social media, sensors, log files and transactional applications, big data has found a host of vertical market applications, ranging from fraud detection to scientific R&D.

  • China retail sales rise with a 10.9 per cent in March

    China retail sales rise with a 10.9 per cent in March

    China’s retail sales rose 10.9 per cent in March – the best month of the year to date.

    However the quarterly rise was just shy of 10 per cent – the first time the official figure has dropped below 10 per cent in 11 years according to the National Bureau of Statistics. IN January and February, China retail sales rose 9.5 per cent each month.

    Retail sales of consumer goods totalled 8.5823 trillion yuan (US$1.25 trillion) from January to March.

    There was strong consumption potential in rural areas, the data shows, with retail sales climbing 11.9 per cent during the quarter, outpacing urban areas where sales rose 9.7 per cent year-on-year.

    Online sales continued their run of strong growth, surging 32.1 per cent in the first two months to 1.405 trillion yuan.

    As a main driver of economic growth, consumption contributed to 64.6 per cent of China’s GDP growth last year. The nation is aiming for a steady increase in consumer spending this year.

  • Global smart transportation market expected to reach US$237,701 million by 2022

    Global smart transportation market expected to reach US$237,701 million by 2022

    According to a new report published by Allied Market Research, titled, “Smart Transportation Market by Solution and Service: Global Opportunity Analysis and Industry Forecast, 2014-2022,” the global smart transportation market was valued at US$63,667 million in 2015, and is expected to reach US$237,701 million by 2022, growing at a CAGR of 18.6 percent from 2016 to 2022. Cloud services segment is anticipated to dominate the market during the forecast period. Europe was the dominant region, accounting for approximately 33 percent share of the smart transportation market revenue in 2015.

    Rise in number of vehicles results in high traffic congestion, leading to the requirement of smart transportation network to ease traffic congestion, enhance the safety, sustainability, and efficiency of transportation network. In addition, most consumers are now demanding smart transportation options that can easily navigate the roads with the least possible scope of congestion. The increasing government support and investments towards development of smart cities provides a major boost to the market. For instance, the Government of India aims to develop 100 smart cities by using smart technology to improve the efficiency of services and meet the residents’ needs. However, the need for high capital investment, owing to the complete restoration of the existing transport system, restrains the market growth.

    “Smart transportation system is a necessity, owing to the rising demand for efficient transportation networks worldwide. These systems have witnessed the highest growth in cloud services segment, due to the advancement in technology and increased demand for storage, access, and management of data remotely. In addition, parking management systems are expected to increase their market share at a notable rate. Asia-Pacific and Brazil possess enormous opportunities for the players operating in the smart transportation systems market.” states Sheetanshu Upadhyay, research analyst at Allied Market Research.

    The solutions segment is divided into hybrid ticketing management system, parking management & guidance system, integrated supervision system, and traffic management system. In 2015, traffic management system accounted for the largest revenue, owing to rapid urbanization and the emerging concept of smart cities and smart traffic. However, the parking management system market is anticipated to witness the highest growth, with a CAGR of 18.8 percent from 2016 to 2022.

    The service segment is further divided into business, professional, and cloud services. In 2015, cloud services generated the largest revenue, owing to rapid increase in demand for cloud services smart transportation system. However, this segment is anticipated to witness the highest growth over the forecast period, with a CAGR of around of 18.8 percent  from 2016 – 2022.

    Europe held the largest market share in 2015, and is anticipated to maintain its dominance throughout the forecast period. This is due to increase in demand for smart transportation and concern of users towards the environment. Additionally, investments in emerging smart cities would create growth opportunities for the smart transportation market in the region.

  • Connected things on pace for 31% surge in 2017

    Connected things on pace for 31% surge in 2017

    Globally, 8.4 billion connected things will be in use in 2017, up 31% from 2016, and will reach 20.4 billion by 2020, according to projections from Gartner.

    Total spending on endpoints and services will meanwhile reach almost $2 trillion in 2017, the research firm predicts.

    Regionally, Greater China, North America and Western Europe are driving the use of connected things and the three regions together will represent 67% of the overall Internet of Things (IoT) installed base in 2017.

    The consumer segment is the largest user of connected things with 5.2 billion units in 2017, which represents 63% of the overall number of applications in use. Businesses are on pace to employ 3.1 billion connected things in 2017.

    “Aside from automotive systems, the applications that will be most in use by consumers will be smart TVs and digital set-top boxes, while smart electric meters and commercial security cameras will be most in use by businesses,” said Peter Middleton, research director at Gartner.

    In addition to smart meters, applications tailored to specific industry verticals — including manufacturing field devices, process sensors for electrical generating plants and real-time location devices for healthcare — will drive the use of connected things among businesses through 2017, with 1.6 billion units deployed.

    However, from 2018 onwards, cross-industry devices, such as those targeted at smart buildings — including LED lighting, HVAC and physical security systems — will take the lead as connectivity is driven into higher-volume, lower cost devices.

    In 2020, cross-industry devices will reach 4.4 billion units, while vertical-specific devices will amount to 3.2 billion units.

    While consumers purchase more devices, businesses spend more. In 2017, in terms of hardware spending, the use of connected things among businesses will drive $964 billion.

    Consumer applications will amount to $725 billion in 2017. By 2020, hardware spending from both segments will reach almost $3 trillion.

    Total IoT services spending (professional, consumer and connectivity services) is on pace to reach $273 billion in 2017.

  • The outlook for Singapore’s real estate market in 2017

    The outlook for Singapore’s real estate market in 2017

    Singapore’s soft real estate market in Singapore was given a boost last year. Investment volume rose 34 percent year-on-year to US$9.4 billion, underpinned by major deals such as the sale of Asia Square Tower 1 and a series of transactions, including a top bid for the prime Central Boulevard white site in the Marina Bay area.

    “The Singapore property market is poised for a recovery in 2017. GDP growth and inflation are expected to pick up in 2017, driving stronger demand for real estate,” says Regina Lim, JLL’s National Director, Advisory and Research, Capital Markets. “In most sectors, we also saw an increase in transaction volumes, including residential property sales and office building transactions.”

    The Lion City is traditionally seen as a safe haven for property investment. It is likely that investment volume will hold up 2017 even as new supply continues to enter the market. Among them are Grade A buildings in the Central Business District, Marina One and Tanjong Pagar Centre. These new office buildings have attracted stronger than expected pre-commitments. And about 50 percent of the office space in buildings completed in 2016 to 2017 have already been leased.

    The sale of Central Boulevard at S$2.57 billion, or S$1,689 per square foot per plot ratio, which is the highest bid ever for a Government Land Sale site in Singapore, signals strong investor optimism – with projections that prime rents would rise over the next five years.

    Retail and residences
    “While demand for office, retail and food and beverage real estate slowed between 2012 and 2015, we believe this bottomed out in 2016 and we expect a modest recovery in the next couple of years,” says Chris Fossick, Managing Director, Singapore and Southeast Asia, JLL.

    Gross domestic product is expected to grow 2.3 percent in 2017, an increase from 1.8 percent in 2016.

    The stronger tourist arrival figures and slightly higher economic growth will help bolster retail assets. “We expect more retail malls to transact. Good quality, well-positioned retail assets are likely to be attractive to core investors as yields are still higher than office assets, and occupancies have always been resilient even in recessions,” adds Lim.

    Singapore’s prime residential market remains attractive for investors compared to other global cities. The latest data from JLL shows that prime residential prices are 126 percent higher in Hong Kong, 62 percent higher in New York and 22 percent higher in London.

    And based on JLL estimates in a report, luxury prime properties in Singapore have corrected on average 18 percent, while mass market prices have softened about 10 percent.

    Developers are keen to attract buyers and beat the deadline of selling units within two years of completion as mandated by the Residential Property Act by offering discounts and block deals. Nearly S$2 billion worth of residential units were sold via block deals or structured vehicles in 2016; more of such deals are expected in the next two years.