Retail News CRM

Tag: stocks

  • Vietnam Stocks Break Records: VN-Index Hits 1,909.01 Points Amidst Market Surge

    Vietnam Stocks Break Records: VN-Index Hits 1,909.01 Points Amidst Market Surge

    On Thursday, Vietnam’s principal stock index, VN-Index, concluded trading at an unprecedented high of 1,909.01 points. This represented a 0.94% increase from the previous day’s closing figure. Trading activity on the Ho Chi Minh Stock Exchange, which is the platform where the index is listed, surged by 26%, amounting to a total value of VND30 trillion (US$1.14 billion).

    Key Movers on the VN-Index

    In the VN30 index, which represents the 30 most significant capped stocks, 13 stocks registered gains. Leading the pack were STB of the Ho Chi Minh City-based Sacombank and VHM of the real estate titan Vinhomes, each recording a substantial 7% increase. Other notable gainers included LPB of Fortune Vietnam Bank, which climbed 3.6%, and HDB of HDBank, which closed 3.4% higher.

    However, not all stocks shared in these gains. Thirteen stocks in the VN30 index ended the day in negative territory, with the most significant drop being GAS of state-owned Petrovietnam Gas, which fell by 4%. Other significant losses were registered by DGC of Duc Giang Chemicals Group, which slipped 3.4%, and PLX of fuel distributor Petrolimex, which ended the day 3.3% lower.

    Foreign Investors’ Activity

    For the eleventh consecutive trading session, foreign investors were net sellers, offloading VND311 billion worth of stocks. Among the stocks most sold by these investors were FPT of tech behemoth FPT Corporation, ACB of Asia Commercial Bank, and KDH of property company Khang Dien House.

    The HNX-Index, representing stocks on the Hanoi Stock Exchange, which is home to mid and small cap stocks, fell by 0.28%. On the other hand, the UPCoM-Index for the Unlisted Public Companies Market finished the day 0.42% higher.

    Questions & Answers

    What was the closing figure for Vietnam’s VN-Index on Thursday?
    The VN-Index closed at 1,909.01 points on Thursday, marking a new peak.

    Which stocks led gains on the VN-Index?
    STB of Sacombank and VHM of Vinhomes led the gains, each with a 7% increase.

    What was the performance of foreign investors on the VN-Index?
    Foreign investors were net sellers for the 11th consecutive session, selling off VND311 billion.

  • Vietnam’s VN-Index Plunges: Longest Losing Streak in Seven Years Sparks Market Concern

    Vietnam’s VN-Index Plunges: Longest Losing Streak in Seven Years Sparks Market Concern

    The VN-Index of Vietnam, which is the country’s benchmark index, experienced a decline for the seventh consecutive session on Wednesday. This represents the most extended losing streak since 2018’s final quarter. The VN-Index wrapped up the session at 1,802.91, marking a decrease of 1.51% or 27.59 points. From the beginning of the previous week, the index underwent a loss of 100 points.

    Trade Volume Increase and Major Price Movements

    A significant increase of 34% was recorded in the trading volume on the Ho Chi Minh Stock Exchange, reaching VND33.7 trillion (equivalent to US$1.29 billion).

    The VN-30 basket, which is a compilation of the 30 most significant capped stocks, witnessed a fall in 16 tickers. The VIC ticker of the private conglomerate Vingroup reached its lowest price point.

    In the realm of retail real estate, Vincom Retail’s VRE experienced a decrease of 5.8%, while the VHM of property titan Vinhomes suffered a reduction of 5.7% in its closing price.

    On the more positive side, eleven blue-chip stocks recorded gains. Among them, MSN of the Masan Group conglomerate saw a rise of 3.7%, FPT of tech powerhouse FPT Corporation increased by 2.4%, and GAS of the state-owned Petrovietnam Gas experienced a boost of 2.3%.

    Foreign Investor Activity and Other Indexes

    Foreign investors ended up as net sellers, with a net selling volume reaching VND1.78 trillion. This selling activity mainly targeted HDB of HDBank and ACB of Asia Commercial Bank.

    Taking a look at other indexes, the HNX-Index, associated with stocks on the Hanoi Stock Exchange, which mainly includes mid and small cap stocks, recorded a fall of 0.15%. Meanwhile, the UPCoM-Index, representing the Unlisted Public Companies Market, saw an increase of 0.62%.

    Questions & Answers

    What is the VN-Index?
    The VN-Index is a benchmark index in Vietnam that represents the performance of the country’s stock market.

    Which stocks experienced a price decrease?
    The VIC of Vingroup, VRE of Vincom Retail, and VHM of Vinhomes were among the stocks that saw a decrease in price.

    Which stocks saw a price increase?
    Among the stocks that recorded a price increase were MSN of the Masan Group, FPT of FPT Corporation, and GAS of Petrovietnam Gas.

  • Vietnam Stocks Plunge to Three-Week Low: VN-Index Slips Amid Massive Selloff

    Vietnam Stocks Plunge to Three-Week Low: VN-Index Slips Amid Massive Selloff

    On Friday, Vietnam’s key VN-Index experienced a significant drop of 3.06%, settling at 1,656.89 points, the lowest it’s seen since November 19. This marked the fourth consecutive session that the index has ended in negative territory.

    Trade Volume Soars on Ho Chi Minh Stock Exchange

    Trading on the Ho Chi Minh Stock Exchange, which forms the basis for the VN-Index, saw a significant increase in activity. The volume of trades surged by 52%, amounting to a total of VND24.7 trillion (US$938 million).

    Most Large Cap Stocks Experience Decline

    In the VN30 group, which encompasses the 30 largest capped stocks, 29 saw a decrease. Notably, Vinhomes, a real estate heavyweight, and Vincom Retail, a retail real estate subsidiary, experienced a substantial decline of 6.9%.

    Other major companies also experienced losses, including private lender VPBank, which saw a drop of 5.7%, and Vietnam Rubber Group, which fell by 5.1%.

    In contrast, Becamex Investment and Industrial Development was the only blue-chip stock that managed to stay in positive territory, albeit with a slight gain of 0.2%.

    Foreign Investors Continue Selling Trend

    Foreign investors continued their selling streak for the sixth session in a row, leading to a net sale of VND571 billion. The most significant sales were from private conglomerate Vingroup and state-owned lender Vietcombank.

    Other Indices Also See Decrease

    Other indices also experienced a decrease. The HNX-Index, which lists stocks on the Hanoi Stock Exchange, primarily those of mid and small-cap companies, decreased by 2.26%. Meanwhile, the UPCoM-Index for Unlisted Public Companies Market fell slightly by 0.61%.

    Questions & Answers

    What is the VN-Index?
    The VN-Index is a capitalization-weighted index of all the companies listed on the Ho Chi Minh Stock Exchange.

    What was the significant trade on Friday?
    On Friday, trading on the Ho Chi Minh Stock Exchange surged by 52%, reaching a total of VND24.7 trillion (US$938 million).

    Which stock experienced the greatest loss on Friday?
    Real estate giant Vinhomes and retail real estate arm Vincom Retail saw the most significant losses, both dipping by 6.9%.

  • Vietnam Stocks Soar to Six-Week High: A Remarkable Upsurge on the VN-Index

    Vietnam Stocks Soar to Six-Week High: A Remarkable Upsurge on the VN-Index

    On Tuesday, the VN-Index, Vietnam’s benchmark index, rose by 0.9% to reach 1,717.06 points. This marked the highest level it had reached since October 17. The index ended the day 15 points higher, with a total increase of over 56 points across the previous five sessions.

    Growth in Trading

    The Ho Chi Minh Stock Exchange, where the index is located, experienced a 6.4% increase in trading. The trade value came to VND22.39 trillion, equivalent to US$849 million.

    Significant Stock Movements

    The VN30 basket comprises the 30 largest capped stocks, of which 20 saw an increase in their share prices. Leading the pack was Sabeco’s SAB and Vietjet’s VJC, both of which saw a significant 6.9% increase in their share prices. They were closely followed by the Vietnam Rubber Group’s GVR, which saw an increase of 3.9%, and Techcombank’s TCB, which experienced a 3% hike in its share price.

    On the other hand, five blue-chip stocks experienced a drop, with VPBank’s VPB seeing the most significant decline of 1.4%.

    Foreign Investment

    In terms of foreign investment, investors were net buyers, with VND637 billion invested predominantly in Vietjet’s VJC and Vingroup’s VIC.

    Other Indices

    Other exchanges also saw a rise in their indices. The HNX-Index on the Hanoi Stock Exchange, famous for mid and small-cap stocks, saw an increase of 0.37%. Meanwhile, the UPCoM-Index for the Unlisted Public Companies Market experienced an increase of 0.47%.

    Questions & Answers

    What was the highest point reached by the VN-Index on Tuesday?
    The VN-Index reached its highest point since October 17 on Tuesday, concluding at 1,717.06 points.

    Which stocks led the increase in the VN30 basket?
    The stocks that led the increase in the VN30 basket were Sabeco’s SAB and Vietjet’s VJC, each experiencing a 6.9% rise in share price.

    What was the trend among foreign investors?
    Foreign investors were predominantly net buyers, notably investing in Vietjet’s VJC and Vingroup’s VIC.

  • Vietnam Stocks Celebrate Largest Leap in a Month: Key Players and Factors in the Remarkable 2.16% Surge

    Vietnam Stocks Celebrate Largest Leap in a Month: Key Players and Factors in the Remarkable 2.16% Surge

    On Tuesday, Vietnam’s leading VN-Index experienced a significant increase, soaring by 2.16% to reach 1,654.98 points, marking the largest surge since October 6. This remarkable growth allowed the index to close approximately 35 points higher, a notable recovery from the 69-point decline it experienced over the previous three sessions.

    The trading value also increased significantly, rising by 16% to reach VND34.25 trillion, equivalent to US$1.3 billion.

    Dominant Performers

    The VN30 basket, which consists of the 30 highest capped stocks, saw impressive growth in 24 tickers. The rise was spearheaded by SSI Securities Corporation, VPBank, and Vincom Retail, each experiencing a gain of 6.9%. Other strong performers included Techcombank, which closed 4.2% higher, and MB, which rose by 3.9%.

    Despite the general upward trend, there were a few stocks that did not follow suit. The most notable of these were the tech heavyweight FPT Corporation and the state-owned Petrovietnam Gas, both of which saw a 1.6% decrease.

    Foreign Investment

    Foreign investors demonstrated significant activity, making net purchases worth VND1.22 trillion. Notably, the majority of this investment was directed towards HDBank and Masan Consumer.

    Lastly, the HNX-Index, which hosts mid-cap and small-cap stocks on the Hanoi Stock Exchange, rose by 2.6%. Simultaneously, the UPCoM-Index for the Unlisted Public Companies Market closed 0.57% higher.

    Questions & Answers

    What was the percentage increase of the VN-Index?
    The VN-Index increased by 2.16%.

    Which companies led the rise in the VN30 basket?
    The rise was led by SSI Securities Corporation, VPBank, and Vincom Retail, each with a 6.9% gain.

    What was the trend among foreign investors?
    Foreign investors were net buyers, mainly investing in HDBank and Masan Consumer.

  • Samsung ‘shock’ as profits start to droop

    Samsung ‘shock’ as profits start to droop

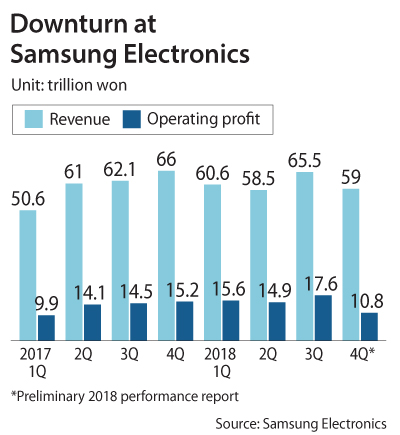
    Samsung Electronics announced sharply lower earnings for the fourth quarter, an earnings “shock” that suggested that the “supercycle” in the global semiconductor market is nearing an end. Preliminary 2018 performance numbers released Tuesday predicted the local IT giant’s operating profit between October and December of last year would be 10.8 trillion won ($9.6 billion), down 28.71 percent year on year.

    This is the lowest figure since the first quarter of 2017’s 9.9 trillion won. Between those two quarters, operating profit had consistently stayed in the 14 to 17 trillion won range.

    Revenue for last year’s fourth quarter slumped 10.58 percent year on year to 59 trillion won. Last year’s third quarter saw record quarterly highs of 65.5 trillion won in revenue and 17.6 trillion won in operating profit.

    Local analysts had expected 13.4 trillion won in operating profit for the fourth quarter and 63.2 trillion won in revenue, according to the stock information provider FnGuide.

    Samsung did not reveal performance figures for different business divisions, but the company cited “slow demand” in semiconductors as a major factor in a public announcement the same day. The IT giant has three major business divisions: chips, smartphones and home electronics.

    The results for all of 2018 showed that the company had a record high operating profit of 58.89 trillion won, a 9.77 percent jump from last year, and 243.5 trillion won in revenue, up 1.64 percent year on year.

    Before starting to slow, semiconductors were the main contributors to Samsung’s high performance over the last two years.

    In the announcement, the company added that demand from data center clients in the fourth quarter had fallen short of expectations.

    “Shipping of memory chips retreated from the third quarter, and the price decline turned out to be bigger than what we expected earlier this year,” it said.

    One reason is because companies with data centers such as Amazon, Facebook and Microsoft bought large amounts of dynamic random-access memory (DRAM) chips during the last two years, which are now piling up.

    DRAM prices started to fall after more than a year of increases – another factor that is affecting demand as companies anticipate more price cuts.

    Slow growth in smartphone sales and one-off expenses including the company’s offering of incentives to staff at the year’s end also affected the profit level.

    Worries that the semiconductor supercycle was ending have surfaced for years, but Samsung and other chipmakers have reported strong earnings – until the fourth quarter.

    December’s chip exports from Korea retreated for the first time in 27 months. The general consensus among local analysts is that Samsung’s revenue will continue to shrink in the first half of this year.

    But they have a more positive outlook for the second half.

    “Memory chip prices will bounce back in the second half of 2019,” said analyst Lee Jae-yun of Yuanta Securities. “Because the supply growth rate of major chipmakers in 2019 will be 19 percent [year on year], whereas demand growth is expected to reach 20 percent.”

  • Crypto Trading Patterns and Their Implications

    Crypto Trading Patterns and Their Implications

    Cryptocurrency trading has grown exponentially over the past decade, with millions of traders entering the market seeking profits from digital assets like Bitcoin, Ethereum, and altcoins. Unlike traditional financial markets, crypto trading is characterized by high volatility, 24/7 operation, and a relatively young and unregulated ecosystem. These characteristics make it a fertile ground for technical analysis, especially trading patterns that reveal the psychology and behavior of market participants.

    Trading patterns—recurring shapes and trends found in price charts—are central to technical analysis. They help traders anticipate potential price movements and make informed decisions. Whether you’re a novice investor or a seasoned professional, recognizing and understanding crypto trading patterns can give you a significant edge.

    This article delves into various crypto trading patterns, their implications, and how traders can leverage them for strategic positioning. We will also explore their strengths, weaknesses, and real-world examples to highlight their practical utility.

    Trading patterns are visual representations of price action that indicate potential future behavior. They are generally classified into three types:

    Understanding Trading Patterns in Crypto Markets

    • Continuation Patterns: Suggest the current trend will likely continue.
    • Reversal Patterns: Indicate a possible change in trend direction.
    • Neutral Patterns: Show indecision or potential for breakout in either direction.

    These patterns are derived from historical price data and are a core component of chart analysis. Their reliability varies based on time frames, volume, and market conditions.

    Common Types of Trading Patterns

    Head and Shoulders

    A classic reversal pattern characterized by three peaks: a higher one (the head) between two lower ones (the shoulders). A breakdown below the neckline signals a bearish reversal.

    • Implication: Signals the end of an uptrend and the beginning of a downtrend.
    • Example: Bitcoin’s 2018 bear market saw a head and shoulders pattern form before it fell from $12,000 to $6,000.

    Double Top and Double Bottom

    These are strong reversal indicators:

    • Double Top: Indicates bullish exhaustion; followed by a bearish reversal.
    • Double Bottom: Indicates bearish exhaustion; followed by a bullish reversal.

    Triangles (Ascending, Descending, Symmetrical)

    Triangles are continuation or breakout patterns:

    • Ascending Triangle: Bullish signal during uptrends.
    • Descending Triangle: Bearish signal during downtrends.
    • Symmetrical Triangle: Neutral; breakout direction depends on volume.

    Flags and Pennants

    Short-term continuation patterns formed during sharp movements:

    • Flags: Rectangular patterns that show a brief consolidation.
    • Pennants: Smaller, symmetrical triangle formations post a price spike.

    Implications of These Patterns in Real Trading

    Trend Confirmation

    Patterns like ascending triangles or bullish flags help traders confirm the strength of a trend. For instance, Ethereum displayed a clear bullish flag in its 2021 rally from $1,500 to over $4,000, supporting long positions.

    Entry and Exit Strategy

    Recognizing patterns aids in identifying strategic entry/exit points:

    • Buy at breakout above resistance (in bullish patterns).
    • Sell at breakdown below support (in bearish patterns).

    Stop-Loss Placement

    Patterns provide natural zones for stop-loss orders. For example, placing a stop just below the support line of a double bottom ensures risk mitigation.

    Case Studies and Real-World Examples

    • Bitcoin 2021 Bull Run: An ascending triangle formed between January and March. A breakout above $42,000 led to a surge toward $64,000.
    • Terra Luna Collapse: Before its crash, analysts noted a descending triangle—a bearish indicator that preceded a significant drop.

    These examples underscore how correctly identifying and interpreting patterns can lead to profitable trades—or avert major losses.

    Pros and Cons of Using Trading Patterns

    Pros:

    • 📈 Predictive Power: Offer insight into potential market direction.
    • 🔄 Versatility: Apply to multiple timeframes and assets.
    • 🛠️ Tool for Risk Management: Useful in setting stops and limits.

    Cons:

    • Subjectivity: Interpretation can vary between traders.
    • ⚠️ False Signals: Especially in low-volume or manipulated markets.
    • 🧩 Complexity: Some patterns require experience to identify accurately.

    Integrating Trading Patterns with Other Strategies

    For optimal results, trading patterns should be used alongside:

    • Volume Analysis: Confirms pattern validity.
    • Indicators: RSI, MACD, and moving averages refine entries.
    • News and Sentiment: External events can invalidate pattern implications.

    Successful traders often combine pattern recognition with quantitative strategies or affiliate monetization models. If you’re considering turning your trading knowledge into a business, exploring opportunities through a casino affiliate network can be lucrative. These networks allow crypto-savvy marketers to earn commissions from referring traders to platforms that also accept digital assets.

    Understanding crypto trading patterns is essential for anyone looking to succeed in this fast-paced market. Patterns are not just abstract shapes—they are visual manifestations of market sentiment, fear, greed, and momentum. By mastering these formations, traders gain the tools to predict movements, plan entries and exits, and avoid costly mistakes.

    Conclusion

    However, patterns must not be used in isolation. Their efficacy increases significantly when combined with other analysis tools, market awareness, and proper risk management. Additionally, traders can multiply their income streams by monetizing their expertise—whether through educational content, community building, or affiliate marketing using a casino affiliate network that caters to trading audiences.

    In a world where markets never sleep, trading patterns offer a strategic compass. They guide decision-making, enhance timing, and, when used wisely, can turn volatility into opportunity.

    Questions & Answers

    What are trading patterns?

    Trading patterns are chart formations that signal potential price direction based on historical price data and market behavior.

    Are trading patterns reliable?

    While no pattern guarantees results, many have proven statistically significant over time—especially when supported by volume and market context.

    Can beginners use trading patterns?

    Yes, but beginners should start with basic patterns like head and shoulders, triangles, and double tops/bottoms, and always back-test before live trading.

    What’s the difference between a continuation and a reversal pattern?

    Continuation patterns suggest the trend will persist, while reversal patterns imply a trend change.

    How can I learn to recognize patterns?

    Start with technical analysis books, online courses, and platforms like TradingView. Practice by analyzing historical charts.

    Do patterns work on all timeframes?

    Yes, but higher timeframes (daily, weekly) generally yield more reliable signals than shorter ones (5min, 15min).

    What if a pattern fails?

    Always use risk management techniques. No pattern is 100% reliable, and false breakouts are common.

    How important is volume in pattern analysis?

    Very important. Rising volume during a breakout validates the pattern and increases the probability of a successful trade.

    Can I automate pattern trading?

    Yes. Many bots and algorithmic platforms support pattern recognition. However, always test thoroughly before deploying.

    Can I monetize trading knowledge?

    Yes. Becoming part of a casino affiliate network focused on trading platforms is one way to earn passive income by referring other traders.
  • VN-Index Hits New Heights with Third Consecutive Day of Gains

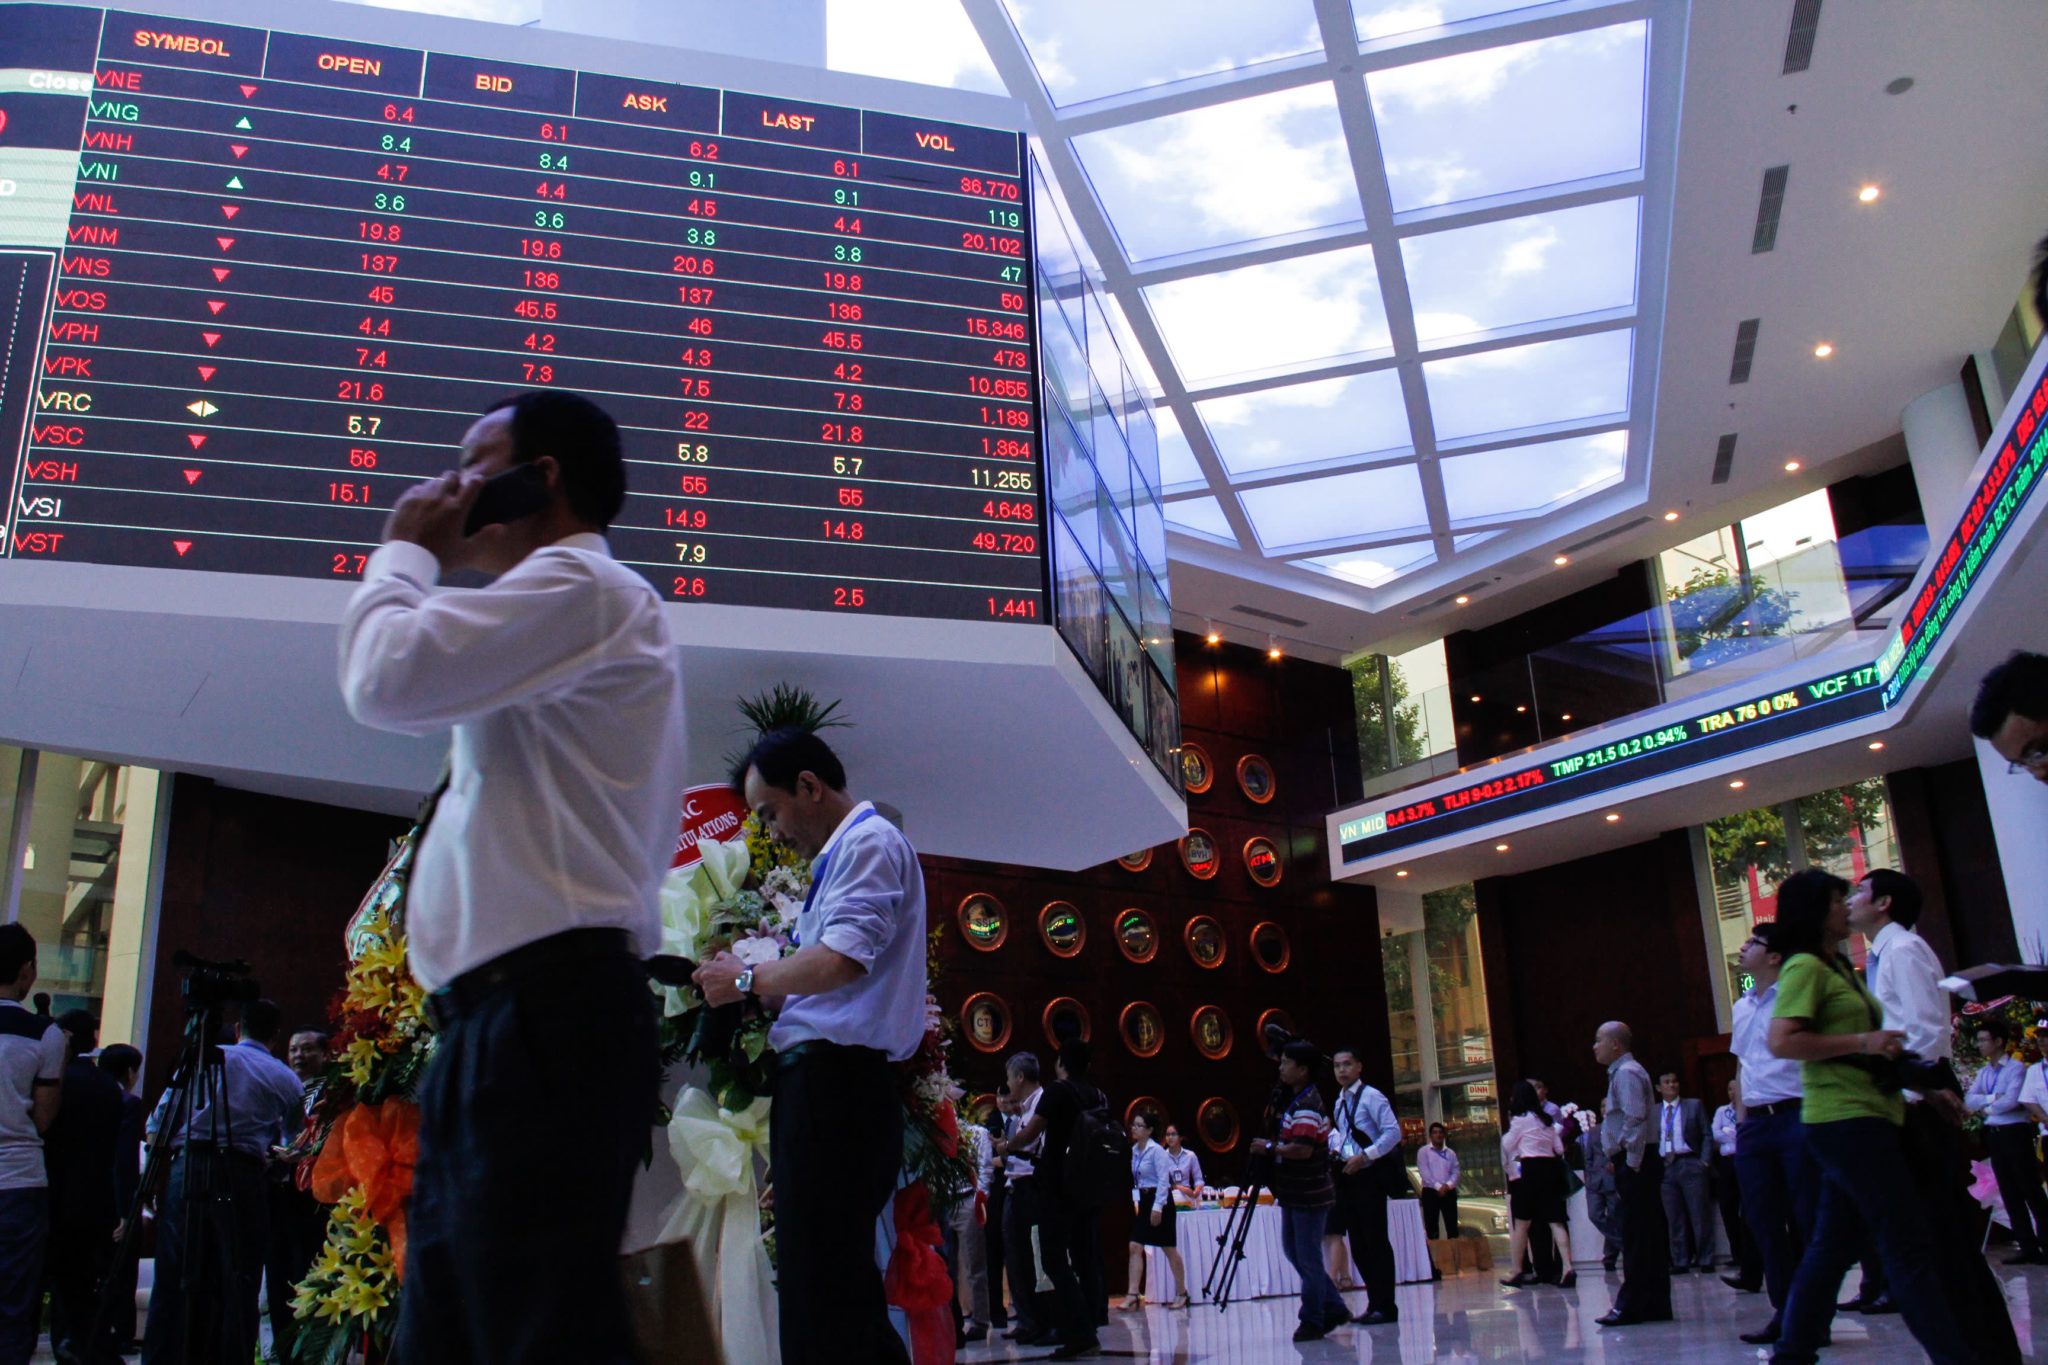
    Vietnam’s stock market is buzzing, with the VN-Index soaring by 1.26% to an impressive 1,309.73 points on Wednesday, marking the third consecutive session of growth. This robust performance follows a modest dip of 16.3 points, coming off a gain of 10 points the previous day. Interestingly, the index has experienced a surge in seven out of the eight trading days this month alone—quite the streak!

    Trading Activity Hits New Highs

    On the Ho Chi Minh Stock Exchange, trading volume witnessed a 10% increase, reaching VND 27.33 trillion (approximately US$1.05 billion), the highest level seen in three weeks. The VN-30 basket, which tracks the 30 largest listed companies, showcased a strong showing with 22 of its members recording gains. Among the standout performers, VPB, affiliated with private lender VPBank, remarkably hit its ceiling price.

    Tech giant FPT Corporation also made waves, with its stock climbing by 5.69%. The state-owned lender BIDV wasn’t far behind, rising by 4.61%. Yet, not all was rosy, as seven blue-chip stocks faced a decline. Vincom Retail’s VRE dropped by 2.76%, while property heavyweight Vinhomes, represented by VHM, ended 2.58% lower.

    Foreign Investment Takes Center Stage

    In a stroke of positivity, foreign investors emerged as net buyers, purchasing a net amount of VND 2.26 trillion, predominantly focusing on FPT and VPB stocks. Over on the Hanoi Stock Exchange, the HNX-Index, which features mid and small-cap stocks, edged up by 0.23%. Additionally, the UPCoM-Index for unlisted public companies increased by 0.24%.

    As the market continues to make significant gains, one can’t help but wonder: is it dancing with joy or just warming up for a more exhilarating performance?

    Questions & Answers

    What influenced the VN-Index growth recently?
    An increase in trading volume, particularly in large-cap stocks like VPBank and FPT, has significantly boosted the VN-Index.

    How have foreign investors impacted the market?
    Foreign investors have turned net buyers, acquiring a significant amount of shares, especially in top-performing companies like FPT and VPB.

    What trends are emerging in Vietnam’s stock market?
    The trend shows a strong recovery with consistent gains, indicating positive sentiment and increasing investor confidence in the market.

  • Retail Stocks Surge to 9-Day High Amid Rising Consumer Demand

    Retail Stocks Surge to 9-Day High Amid Rising Consumer Demand

    The VN-Index has made a notable leap, rising by 1.02% to reach 1,223.35 points on Thursday, marking the highest level since April 15. This upward momentum reflects ongoing positive market sentiment and a mix of investor activity across key sectors.

    Market Overview

    The benchmark index ended the trading day up by 12.35 points, building on a gain of 13.87 points from the prior session. Despite the positive performance, trading volume on the Ho Chi Minh Stock Exchange dipped by 7%, totaling VND17.66 trillion (approximately US$679 million).

    Key Performers in the VN-30

    Among the 30 largest capped stocks in the VN-30 basket, a robust majority of 18 stocks closed with gains. Leading the charge was Vingroup’s VIC, which surged by 7%. Also in the spotlight were Bao Viet Holdings’ BVH, up 5.6%, and real estate giant Vinhomes’ VHM, which rose by 4.6%. HDBank’s HDB rounded out the top performers with a 4.4% increase.

    Conversely, eight blue-chip stocks experienced declines. Asia Commercial Bank (ACB) saw a decrease of 1.8%, while Techcombank (TCB) fell by 1.3%.

    Foreign Investment Trends

    Foreign investors remained active participants in the market, concluding the day as net buyers with a total purchase of VND574 billion, primarily focused on Hòa Phát Group’s HPG and the electronics retailer Mobile World (MWG). This trend signals a growing confidence from foreign stakeholders in the Vietnamese market and its expanding opportunities.

    Regional Indices Movement

    In related exchanges, the HNX-Index of the Hanoi Stock Exchange, which features mid and small-cap stocks, ticked down by 0.18%. Meanwhile, the UPCoM-Index for unlisted public companies experienced a modest rise of 0.40%, showcasing a slight differentiation in performance among various market segments.

    In summary, the upward trajectory of the VN-Index and the impressive gains among key stocks reflect a vibrant and dynamic market landscape. As investor confidence grows, particularly with significant foreign engagement, the future looks promising for Vietnam’s retail and broader economic sectors.

    Questions & Answers:

    1. What recent milestone did the VN-Index achieve? The VN-Index rose by 1.02% to 1,223.35 points, reaching its highest level since April 15.

    2. How did foreign investors engage with the market? Foreign investors concluded as net buyers, investing VND574 billion, with a focus on stocks like HPG and MWG.

    3. What was the performance of blue-chip stocks? Out of the VN-30 stocks, 18 showed gains, with VIC and BVH leading, while eight stocks, including ACB and TCB, saw declines.

  • Retail Stocks Surge as Consumer Demand Drives Week’s Gains

    Retail Stocks Surge as Consumer Demand Drives Week’s Gains

    VN-Index Posts Modest Gains Amid Active Trading

    The VN-Index, Vietnam’s benchmark stock market measure, rallied 0.48% on Friday, closing at 1,229.23 points, as investor activity intensified.

    Market Overview

    In a buoyant trading session, the index climbed 5.88 points, following a notable increase of 12.35 points in the previous day’s trading. The Ho Chi Minh Stock Exchange saw a trading volume surge of 15%, reaching VND20.35 trillion (approximately USD 782.1 million). This uptick signals increased investor optimism and engagement.

    Key Performers

    The VN-30 basket, which includes the 30 largest listed companies, experienced gains among 15 stocks. Notably, Vingroup (VIC) reached its ceiling price, underscoring strong investor interest. Vietjet Air (VJC) soared by 6.2%, while Vinamilk (VNM) rose 3.6%, reflecting positive consumer trends in the airline and dairy markets, respectively.

    Conversely, 13 blue-chip stocks declined. SeABank (SSB) fell by 2.7%, followed closely by Sacombank (STB) slipping 2.6%, and Fortune Vietnam Bank (LPB) closing 2.1% lower. This mixed performance indicates a cautious sentiment among some investors.

    Foreign Investment Trends

    Foreign investors stepped back as net sellers, offloading VND593 billion worth of shares. The primary targets of this selling spree were tech giant FPT Corporation and Vingroup. This trend may reflect broader concerns about market volatility, impacting long-term investment strategies.

    Broader Market Indicators

    The HNX-Index on the Hanoi Stock Exchange, which showcases mid and small-cap stocks, increased by 0.31%, while the UPCoM-Index for unlisted public companies rose 0.47%. These developments highlight a broader recovery across various market segments.

    Implications for the Retail Sector

    The current market momentum, combined with heightened consumer demand in sectors such as travel and dairy, signals potential growth opportunities for the retail sector. With emerging consumer trends indicating increased spending, retailers can expect heightened interactions with a dynamic investing landscape as they strategize for the upcoming quarters.

  • Stocks close 4th session in red

    Stocks close 4th session in red

    Vietnam’s benchmark VN-Index fell 0.80% to 1,306.86 points Monday for the fourth session in a row.

    The index closed 10.60 points lower after dropping 6.35 points in the previous session.

    Trading on the Ho Chi Minh Stock Exchange increased by 24% to VND21.205 trillion (US$829.1 million).

    The VN-30 basket, comprising the 30 largest capped stocks, saw 20 tickers fell.

    GVR of Vietnam Rubber Group saw the biggest drop of 6.9%, BCM of Becamex Investment and Industrial Development followed with a 3.6% decline. MSN of conglomerate Masan Group was down 2.5%.

    Eight blue chips gained. MBB of lender MB rose 0.8%, TPB of private TPBank closed 0.7% higher, and VNM of dairy giant Vinamilk went up 0.5%.

    Foreign investors were net seller to the tune of VND1.28 trillion, mainly selling FPT of tech giant FPT Corporation and VNM.

    The HNX-Index for stocks on the Hanoi Stock Exchange, home to mid and small caps, fell 1.32%, while the UPCoM-Index for the Unlisted Public Companies Market went down 0.61%.

  • Stocks start week in green

    Stocks start week in green

    Vietnam’s benchmark VN-Index rose 0.64% to 1,330.32 points Monday.

    The index closed 8.44 points higher after dropping 2.05 points in the previous session.

    Trading on the Ho Chi Minh Stock Exchange increased by 15% to VND19.583 trillion (US$763.9 million).

    The VN-30 basket, comprising the 30 largest capped stocks, saw 14 tickers gained.

    VIC of private conglomerate Vingroup saw the biggest jump of 7.0%, followed by VHM of property giant Vinhomes with a 6.3% gain and SHB of Saigon Hanoi Commercial Bank, up 5.5%.

    Thirteen blue chips fell, with LPB of Fortune Vietnam Bank dropping by 1.9%.

    BCM of Becamex Investment and Industrial Development went down 1.8% and VIB of Vietnam International Commercial Bank closed 1.7% lower.

    Foreign investors were net seller to the tune of VND720 billion, mainly selling FPT of tech giant FPT Corporation and TPB of private lender TPBank.

    The HNX-Index for stocks on the Hanoi Stock Exchange, home to mid and small caps, rose 0.07%, while the UPCoM-Index for the Unlisted Public Companies Market went down 0.20%.

  • Stocks rise in first session of the year

    Stocks rise in first session of the year

    Vietnam’s benchmark VN-Index rose 0.23% to 1,269.71 points Thursday in the first session of 2025 while Asian shares began the year slightly lower.

    The index closed 2.93 points higher after dropping 5.24 points in the previous session.

    Trading on the Ho Chi Minh Stock Exchange decreased by 7% to VND10.752 trillion (US$422.4 million).

    The VN-30 basket, comprising the 30 largest capped stocks, saw 12 tickers gained.

    PLX of fuel distributor Petrolimex went up 1.7%, BID of state-owned lender BIDV rose 1.7%, and BVH of insurance company Bao Viet Holdings closed 1.6% higher.

    Eleven blue chips fell. HDB of lender HDBank slid 1.6%, TCB of private lender Techcombank went down 1.2%, and ACB of Asia Commercial Bank saw a 0.8% drop.

    Foreign investors were net seller to the tune of VND98 billion, mainly selling FPT of IT giant FPT Corporation and VCB of state-owned lender Vietcombank.

    The HNX-Index for stocks on the Hanoi Stock Exchange, home to mid and small caps, rose 0.11%, while the UPCoM-Index for the Unlisted Public Companies Market went down 0.04%.

    Globally, Asian stocks began the year on a dour note on Thursday as they struggled for traction after a jittery close to 2024, while the U.S. dollar held steady and investor sentiment stayed cautious ahead of Donald Trump’s return to the White House, Reuters reported.

    While global shares closed out 2024 with a strong yearly gain of nearly 16%, they had clocked a monthly loss of more than 2% in December.

    The same was the case for MSCI’s broadest index of Asia-Pacific shares outside Japan, which slid 1.2% in December though registered a gain of more than 7% for 2024.

    The index was last down 0.58% in the Asian session on Thursday, with volume thinned given a trading holiday in Japan.

    Chinese stocks were battered, with the CSI300 blue-chip index last down 2.65% while the Shanghai Composite Index lost 2.36%. Hong Kong’s Hang Seng Index slid 2.15%.

  • Stocks fail to sustain 2-month high

    Stocks fail to sustain 2-month high

    Vietnam’s benchmark VN-Index fell 0.09% to 1,272.87 points Thursday, after hitting a two-month peak in the previous session.

    The index closed 1.2 points lower after gaining 13.68 points in the previous session.

    Trading on the Ho Chi Minh Stock Exchange decreased dropped 27% to VND18.8 trillion (US$739 million).

    SSB of SeABank dropped 2%, followed by BVH of insurance company Bao Viet Holdings with a 1.9% decline.

    MWG of electronics retail chain Mobile World dropped 1.1% and VRE of retail real estate arm Vincom Retail closed 0.9% lower.

    Eleven blue chips gained, led by six banks.

    VIB of Vietnam International Commercial Bank posted the largest increase at 2.9%, followed by STB of Ho Chi Minh City-based lender Sacombank, up 2.3%.

    Foreign investors were net sellers to the tune of VND365 billion.

    They mainly net sold VCB of state-owned lender Vietcombank and FPT of IT giant FPT Corporation.

    The HNX-Index for stocks on the Hanoi Stock Exchange, home to mid and small caps, rose 0.04%, while the UPCoM-Index for the Unlisted Public Companies Market dropped 0.19%.

    Asia shares eased in holiday-thinned trade on Thursday, paring some of their gains from earlier in the week, while the dollar rose alongside U.S. Treasury yields.

    As the year-end approaches, trading volumes have begun thinning out and the main focus for investors remains that of the Federal Reserve’s rate outlook. Markets in Hong Kong, Australia and New Zealand were closed for a holiday on Thursday.

  • Vietnam stocks gain little as global markets steady

    Vietnam stocks gain little as global markets steady

    Vietnam’s benchmark VN-Index rose 0.08% to 1,245.76 points while global markets showed stability as investors waited for the result of the U.S. election. The index closed 1.05 points higher after dropping 10.18 points in the previous session.

    Trading on the Ho Chi Minh Stock Exchange decreased by 31% to VND10.982 trillion.

    The VN-30 basket, comprising the 30 largest capped stocks, saw 11 tickers gained.

    GVR of Vietnam Rubber Group led with a 1.7% rise, followed by SHB of Saigon Hanoi Commercial Bank, up 1%.

    POW of electricity producer Petrovietnam Power Corporation went up 0.9% and HPG of steelmaker Hoa Phat Group closed 0.8% higher.

    Nine blue chips fell. CTG of state-owned lender VietinBank dropped 1.8% and BID of state-owned lender BIDV declined by 0.6%.

    Foreign investors were net sellers to the tune of VND854 billion. They have been net selling non-stop for the last eight weeks.

    They mainly net sold MSN of conglomerate Masan Group and VHM of property giant Vinhomes.

    The HNX-Index for stocks on the Hanoi Stock Exchange, home to mid and small caps, rose 0.18%, while the UPCoM-Index for the Unlisted Public Companies Market went up 0.30%.

    Globally stocks were steady on Tuesday but implied volatility ratcheted up in currency markets in an early indication of the market frenzy to come, as the world awaits the outcome of a knife-edge U.S. election, Reuters reported.

    Europe’s benchmark STOXX index edged down 0.2% while MSCI’s broadest index of Asia-Pacific shares outside Japan inched 0.7% higher, as stock markets held their breath ahead of Wednesday’s open.

    China’s blue chip CSI300 jumped 2.5% and Hong Kong’s Hang Seng rose 1.4%.