Category: Research

Retail News Asia is committed to providing both local and global retailers with the latest Research throughout the Asian market. This on a daily base.

  • Korea braces for next industrial trends in 2017

    Korea braces for next industrial trends in 2017

    Korean businesses’ quest to step closer to future industries is expected to accelerate in the New Year, regardless of the political scandal, the ongoing investigations into dubious business-political ties and the looming presidential election.

    The year 2016 was an opportunity for general consumers to familiarize themselves with the innovative concepts of technologies. And the year 2017 is likely to see some of these technologies become reality.

    The convergence of the automotive industry with technology will speed up along with a transition to green cars, amid the growing competition in the battery market and the rising price of oil.

    Devices including smartphones and home appliances operated by artificial intelligence will come to the fore, with virtual reality and augmented reality technologies becoming mainstream in the tech world.

    The shifting technologies are also expected to affect the retail market with consumers looking for products that offer experience and value beyond a simple price benefit.

    Go player Lee Se-dol at a press conference at the Four Seasons in Seoul on March 12, 2016

    AI to be next big thing in the tech industry

    Artificial Intelligence, which astonished the world in a match with the top Go player Lee Se-dol, is expected to become the next big thing in the smart device and appliances industry in 2017.

    The nation’s largest tech company Samsung Electronics, which acquired the AI startup Viv Labs in October, seeks to recover from the note 7 debacle with its new AI-based smartphone Galaxy S8, which is set to be unveiled early this year. Viv Labs is the US tech firm set up by Apple’s Siri developers.

    Samsung Electronics’ Vice President Rhee In-jong said in October, “Galaxy S8 will be Samsung’s first platform, which adopts AI-based voice recognition technology,” adding that the technology has reached close to the level of the understanding humans.

    Korean tech firms — both smartphone makers and mobile carriers — are spurring AI development as the technology will ultimately be used to connect and control all home appliances and electronics.

    Samsung is set to unveil more advanced AI-based home appliances, which can be connected via Wi-Fi technology and controlled through smartphones, at the upcoming Consumer Electronics Show in January.

    LG Electronics is also slated to unveil AI-based home appliances, which adopt deep learning technology at the upcoming show. The deep learning technology enables products to provide customized services and functions by learning users’ habits and surroundings.

    The nation’s largest telecom carrier SK Telecom is also upgrading its AI-based speaker NUGU after first launching it in August. This device figures out users’ taste to recommend music, control home appliances and provides customized information such as weather and schedules based on their preferences.

    Market consulting firm IDC predicted that the global AI market would grow 55 percent on average annually from $8 billion in 2016 to $47 billion in 2020.

    Journalists and participants wear the Samsung Gear VR headset at the company‘s flagship Galaxy S7 launch event in Barcelona in February 2016.

    AR, VR to gain bigger presence

    Virtual reality and augmented reality technologies are geared to gain a bigger presence in the tech world in 2017, building upon the landmark developments made in 2016.

    VR is a technology that completely immerses users in computer-generated virtual worlds via a head-mounted display, while AR technology overlays, or augments, digital images onto a person’s view of the world.

    The year 2016 saw the release of next-generation VR headsets such as the HTC Vive, the Oculus Rift and Sony’s Playstation VR, which prompted the emergence of thousands of VR video games and mobile apps.

    The explosive popularity of AR-based mobile game Pokemon Go also highlighted AR’s potential to appeal to the masses on the mobile platform.

    The two cutting-edge technologies are geared to further advance and draw closer to the public in 2017 as the price of VR headsets further drop to boost the VR gaming sector, and as AR technologies are embraced by more industries.

    “After several years of hype, the operative reality behind virtual, augmented and mixed digital worlds is set to manifest more fully in 2017,” IHS Markit said in a recent outlook report.

    The firm expects AR and VR technologies will “advance significantly as Facebook, Google and Microsoft consolidate their existing technologies into more exhaustive strategies.”

    According to tech market intelligence company IDC, worldwide revenues generated by the AR and VR market will jump from just $5.2 billion in 2016 to more than $162 billion in 2020, as the two technologies expand their applications across diverse industries and services.

    IDC predicts that revenues generated by VR systems will surpass that of AR-related revenues until 2017, due to rising consumer uptake of VR-based video games and paid contents.

    After 2017, AR revenues will grow bigger as AR technology finds mass applications across areas such as healthcare delivery, product design and management tasks, it said.

    Just about every major tech company in the world has already entered the race to secure its place in the approaching era of VR and AR technologies. In the lead is Facebook-owned Oculus, Google and Microsoft, with Apple and Samsung Electronics working to catch up.

    Kia’s EV autonomous vehicle Soul

    Auto industry to face unprecedented race

    It was a tough year for the auto industry in Korea with an emissions scandal, strikes, low demand and negative growth.

    With the auto market expected to continue negative growth next year, carmakers will face unprecedented competition in the industry where automotive and technology are converging rapidly.

    South Korea’s largest automaker Hyundai Motor conducted a survey on the most anticipated technology next year. Almost 76,000 of 320,000 voters picked the autonomous driving technology. Although self-driving cars won‘t populate the road next year, most of the major carmakers and tech companies are putting all-out efforts to commercialize the self-driving technology.

    The debut of US electric automaker Tesla Motors and Chinese electric car maker BYD Auto will likely boost the EV market in South Korea, giving customers more choice in this growing segment. Tesla is set to open its flagship store in Korea and BYD officially launched its Korean office in Jeju Island in October.

    Backed by growing popularity, sport utility vehicles will remain as the silver lining for the sluggish auto market, which is expected to decline 1.2 percent on-year.

    Domestic carmakers, especially Hyundai Motor Co and Kia Motors Corp, will face fierce competition in 2017 in the Korean market as imported cars expand its market share. Currently, imported carmakers take up 13 percent of the total market.

    Outside Korea, South Korean automakers will struggle to thrive in mature markets, like the US and EU where analysts expect a zero growth next year, and in China where they saw disappointing sales figures in 2016. China’s auto market is expected to grow 4 or 5 percent in 2017 while other developing markets, like Russia and East Europe, will recover from the 2016 slump.

    China looms over Korean battery makers

    For Korea’s major battery makers — Samsung SDI and LG Chem — concerns over their performance in the Chinese market are likely to persist next year amid the neighboring country’s stricter rules on providing battery certification.

    The two companies have been dealt with a blow after the Chinese government suspended subsidies for electric vehicles using batteries produced by the two firms earlier this year. The two were excluded from the subsidy list as they failed to acquire the battery certification amid tightened regulations in China’s alleged protectionism moves.

    Unless China changes its policies, the Korean battery makers are unlikely to see improvement in their business there, the companies said.

    “While (the company) had anticipated the EV battery certification process will resume in the third quarter, (the Chinese government) did not carry it out. It is difficult to project an accurate timing,” a Samsung SDI official said in the third quarter’s conference call.

    LG Chem shared a similar view.

    “The biggest variable for the company’s sales growth for next year is China. If the status quo continues next year, the automotive battery business growth rate will be around 30 percent. If (the certification issue) is solved, the growth rate will possibly jump up to 60 percent.”

    Amid the higher threshold to the Chinese market, Korean battery makers are seeking to sustain their top position in the global ESS market next year.
    LG Chem topped the global ESS market share with 21 percent this year, standing at No.1 for two years straight, followed by Samsung SDI with 19 percent.

    “Amid the three-party competition of LG Chem, Samsung SDI and BYD Auto in the market, Tesla has risen as the new competitor. As the supply amount of the two Korean companies is projected to surpass 2 gigawatt hours next year, the two are likely to make up half of the market in total,” SNE Research forecasted.

    LG Chem has made aggressive ESS moves with supplying ESS for California’s largest power company SCE and other European companies.
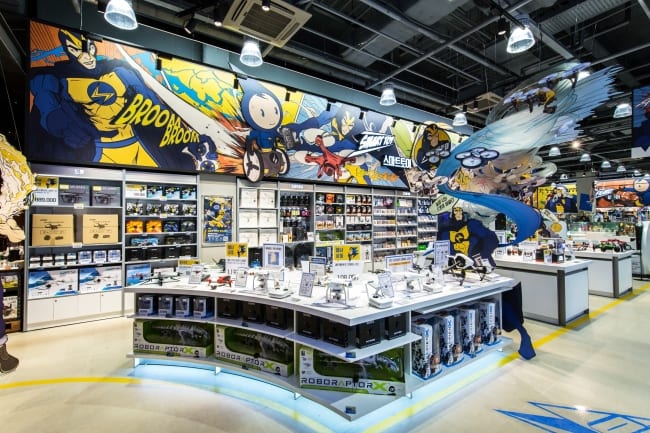
    Experience-focused electronics retailer Electromart at Starfield Hanam

    ‘YOLO’ trend to rule retail in 2017

    In 2016, the retail sector saw consumers shifting their focus to stores and products that offer value and experience, rather than simply low prices.

    Despite the stagnant economy, brands saw consumers reaching for premium and healthy products, packing newly opened malls offering experience-based stores.

    In “Trend Korea 2017,” Seoul National University consumer studies professor Kim Nan-do dubbed this the “YOLO,” or “you only live once,” trend.

    “Consumers who used to think of restraint as a virtue are now enjoying and challenging themselves each moment, and spending money on simple, clear value,” he said.

    The most notable examples of YOLO spending can be found in travel, with consumers facing record-low interest rates choosing to spend money on meaningful experiences rather than saving it away. All retail sectors, meanwhile, have seen consumers choosing to open their wallets and enjoy the “here and now.”

    For example, consumers are buying more decorative products for the home to create better surroundings for themselves. According to the online open market Auction, sales of products like sculptures and music boxes from January to November rose by over 200 percent on-year. Hobby-related products such as classical guitars and model buildings and model airplanes also nearly doubled on-year.

    The Samsung Fashion Research Institute saw “selfness,” or the importance of brands‘ personalities matching those of consumers, to be a major factor moving the fashion industry in 2017.

    Starfield Hanam, a shopping mall featuring stores that allow consumers to experience products as well as buy them, saw nearly 2 million shoppers each month since it opened in September. Starfield Hanam’s popularity during a year when department stores struggled to maintain sales indicated that consumers are visiting and spending money at places that have an element of entertainment, rather than simply shopping options.

    “In an ‘experience economy,’ it will become more important for brands to find new marketing strategies that can satisfy the now-focused experience consumption of the YOLO consumers,” Kim wrote.


  • An iPhone’s journey, from the factory floor to the retail store

    An iPhone’s journey, from the factory floor to the retail store

    Apple buys many of the components for iPhones — like the memory chip, the modem, the camera module, the microphone and the touch-screen controller — from more than 200 suppliers around the world. Foxconn, the Taiwanese company that runs the Zhengzhou facility, even produces some smaller parts, such as metal casings.

    Apple orders many of the components from global suppliers and then sells them, en masse, to one of its contract manufacturers in China. In Zhengzhou, that means Foxconn.

    Foxconn’s facilities in Zhengzhou cover 2.2 square miles and can employ up to 350,000 workers, many of whom earn about $1.90 an hour. The operation does final assembly, testing and packaging.

    There are 94 production lines at the Zhengzhou manufacturing site, and it takes about 400 steps to assemble the iPhone, including polishing, soldering, drilling and fitting screws. The facility can produce 500,000 iPhones a day, or roughly 350 a minute. After the iPhone rolls off the assembly line, it is placed in a sleek white fiberboard box, wrapped and put on a wooden pallet, and then wheeled out to waiting trucks.

    The newly assembled iPhone is transported a few hundred yards beyond the factory gate, where China built a large customs facility. The customs operation sits in a bonded zone, which allows Apple to sell the iPhones more easily to Chinese consumers.

    As the final point of assembly for the iPhone, China also serves as a starting point for Apple’s global tax strategy. In Zhengzhou, often in the customs facility, Foxconn sells the completed iPhones to Apple, which in turn resells them to Apple affiliates around the world.

    The process, most of which takes place electronically, allows Apple to assign a portion of its profits to an affiliate in Ireland, a tax-advantageous locale. The system is not unique to China.

    IPhones bound for the United States and other parts of the world leave customs by truck and are transported three miles to the Zhengzhou airport. The airport has been significantly expanded in recent years, as production of the iPhone has increased.

    Some years ago, personal computers that were made in China were transported to the United States by container ship, with a trip lasting about a month. Smartphones are small enough to be shipped by plane in huge quantities — and cost-effectively. A single wide-body Boeing 747 can easily carry 150,000 iPhones tucked into its aluminum canisters.

    From Zhengzhou, UPS, FedEx and other freight carriers typically fly U.S.-bound iPhones to Anchorage, Alaska. There, they refuel, before going on to Louisville, Ky., a major logistics hub, or other points.

    For an iPhone headed for the China market, customs officials use an electronic system to virtually stamp the goods as “exports” and then restamp them as “imports.” In Zhengzhou, the process happens in the same customs facility just outside the factory.

    Once the products are declared an import, customs can collect a 17 percent value-added tax, a kind of national tax, based on the import price. Afterward, the goods are approved for transport around China. Domestic-bound iPhones are typically loaded onto a large truck and taken on an 18-hour drive from Zhengzhou to Shanghai, in eastern China, where Apple has set up its national distribution center. A single tractor-trailer holds up to 36,000 iPhones. Because the vehicles have about $27 million worth of freight on board, they are equipped with cameras and sometimes accompanied by armed security guards.

    After the iPhone leaves the Foxconn factory in Zhengzhou, it takes two days, on average, to get to a store in Shanghai, a 590-mile trip. It takes three days, on average, to get to a store in San Francisco, some 6,300 miles away.

    IPhones can sell for nearly 20 percent more in China than in the United States.

    Chinese customers pay much higher prices, because of currency fluctuations and the country’s hefty value-added tax.

    A 32-gigabyte iPhone 7 sells for about $776 at the Apple Store in Shanghai. In New York, it goes for $649.

  • Rampant growth of DDoS attacks in 2016

    Rampant growth of DDoS attacks in 2016

    The threat of IoT botnets was realized in 2016 and popularized by Mirai, according to a study by Neustar.

    Mirai and similar types of malware compromise IoT device credentials to enrol them into botnets, which are activated by command and control servers.

    As these code assemblies are published, new developments continue to emerge, such as persistent device enrolment, which enables botnet operators to maintain control of a device even after it is rebooted.

    The study also reported that the frequency of DDoS attack mitigations by the company increased 40% in 2016 compared to the same period of time in 2015, according to a study released by the company.

    “With DDoS attacks predicted to become even more complex and ferocious in 2017, increasingly digital organizations within Asia-Pacific will be exposed to more frequent and severe cyber-attacks,” said Robin Schmitt, general manager for APAC at Neustar.

    Multi-vector attacks, which combine attack vectors to confuse defenders and supplement attack volume, also increased 322% and accounted for 52% of the attacks mitigated by Neustar. UDP, TCP and ICMP comprise the three most popular attack vectors, which were leveraged in more than 50% of attacks.

    The report also showed that DNS-based attacks increased 648% with many attackers leveraging DNSSEC amplification to generate massive volumetric pressure.

  • 83% of smartphone users in India shop online

    83% of smartphone users in India shop online

    Indian retail customers are taking strongly to mobile commerce, with nearly 83 percent of people owning a smartphone saying that they shop online on their mobile phones, new study reveals.

    As expected, customers in the younger age group – 25-34 years old – are using their mobile phones more (90 percent) to shop online.

    However, the State of M-Commerce 2016 survey, conducted by US-based global digital strategy and services firm Regalix Inc., also showed that while a large number of customers have used their mobiles to shop online, there is still much room for growth in terms of the frequency of online shopping.

    Only 53 percent of those surveyed said that they had shopped online within the last month. Moreover, only 25 percent of respondents said that they shopped on their phones at least once a week. There seems to be a gender divide also in the frequency of online shopping, with more men (63 percent) doing so at least once a month than women (40 percent).

    Overall, gadgets and electronics was the most popular product category at 60 percent, followed distantly by clothing and accessories at 20 percent. While 66 percent of men shopped for gadgets online, only 31 percent of women did so. On the other hand, more women (65 percent) shopped online for clothing, accessories and home products as compared to men (27 percent).

    The survey likewise showed that the lion’s share of online retail is divided between three platforms – Flipkart (44 percent), Amazon (32 percent), and Snapdeal (19 percent). Interestingly, preference between these platforms is segmented by age, with Flipkart the preferred retailer for 49 percent of respondents in the 18-24 age group, but only 35 percent in the 25-34 age group. Snapdeal received more support in the 25-34 age group (25 percent) than in the 18-24 group (only 13 percent).

    Another interesting finding is that the number of retail customers shopping online has grown, many still prefer to browse online and purchase offline. Around 42 percent off respondents said that they preferred to do so while purchasing gadgets and electronics, while 33 percent said that they bought clothing and accessories this way.

    Clothing and accessories were the one category in which offline purchasers outnumbered online shoppers across all age and gender groups.

    The two biggest factors influencing a customer’s decision to shop online are Cash-on-delivery (34 percent) and free delivery (34 percent). CoD was the preferred payment mode for the majority of customers, with 62 percent preferring this over net banking, credit/debit cards or mobile wallets.

    Mobile apps are also the preferred way for customers to shop on their phones, with an overwhelming 94 percent declaring they preferred apps to mobile websites. The study also found that while 81 percent of respondents said they were unaffected by mobile ads, a higher percentage of women (25 percent) said that ads influenced their shopping behavior than men (17 percent).

  • India’s internet population to reach 600m by 2020

    India’s internet population to reach 600m by 2020

    India’s rapidly expanding digital population is expected to double to approximately 600 million users by 2020 from 343 million users today, a new study reveals.

    The joint study, conducted The Associated Chambers of Commerce & Industry of India (ASSOCHAM) and Deloitte, also showed that of India’s over one billion mobile subscriptions, smartphone users account for approximately about a fourth or 240 million subscriptions. This is expected to grow to 520 million by 2020.

    While India is the second largest mobile phone market globally, the study noted that over 55,000 villages remain deprived of mobile connectivity, largely because providing mobile connectivity in these locations is not commercially viable for service providers.

    Spectrum availability in Indian metros is also just about a tenth of the same in cities in developed countries, which is a major roadblock to providing high-speed data services.

    The study noted that public Wi-Fi penetration remains low, with only about 31,000 hotspots available. For India to achieve the global average of one Wi-Fi hotspot for every 150 citizens, the country needs over eight million hotspots.

    Rural adoption of data-enabled devices, however, is expected to increase with the BharatNet initiative under the Digital India program, which itself has been hampered by many challenges including a lack of technical skills and capabilities or competent organizations to support the program.

    Other factors include lack of awareness of internet services among Indian consumers and non-availability of most of these digital services in local languages. Moreover, with the proliferation of cloud-based services like DigiLocker, data security has also emerged as a major challenge.

    The recent data breach in August 2016, in which debit card data for more than 3.2 million subscribers was stolen, highlights the importance of implementing foolproof security systems.

    The study recommends that the government should make efforts to make additional spectrum available to telecom service providers for deployment of high-speed data networks and must effectively collaborate with the private sector to develop the digital infrastructure.

    Moreover, it noted that in rural and remote areas, private sector players should be incentivized to provide last mile connectivity. Satellite communication solutions could also be used to speed up broadband access in rural and remote areas. For instance, banks can use VSAT technology to connect remote ATMs, remote branches which need instant access to customer data.

    “In order for the benefits of the Digital India program to reach all sections of the population, improving digital literacy is imperative. A strong skill base is required to support the initiatives and services that are envisaged under the Digital India umbrella,” the study concluded.

  • Digital video software market to exceed $9b by 2021

    Digital video software market to exceed $9b by 2021

    The video software market is expected to exceed $9 billion in revenue by 2021, according to a new report recently released by IHS Markit.

    The atomization of media distribution and the switch from hardware-based technology solutions to cloud implementations are key drivers for the $3 billion in revenue growth over the next five years, according to the new Video Software, Security, and Analytics Intelligence Service report from IHS Technology.

    “Taken together, these two forces have created a market where value is shifting towards the frontend,” said Cecilia Zhu, analyst at IHS Technology. “A superior user-experience has become fundamental to securing increased consumer spend.”

    Globally, content security accounts for 32% of the digital video software market. While demand for robust security solutions is unlikely to deteriorate,  particularly in the presence of high-value UHD and HDR content,  the segment is effectively saturated.

    North America is the key region for the video software market, and generates roughly $2.9 billion. The region’s value relates primarily to confluence of three factors — the presence of large media companies, their outright scale, and their sheer number.

    The region’s economic dominance should not, however, overshadow the existence of cutting-edge video services in Europe, Asia, and the Middle East, and the technology demand that these services generate.

    Cisco has a 15% share of the video software segment, the largest globally. The company has proven adept at transitioning into the video space, and in using its longstanding presence in core, metro, and access-network infrastructure to cross and upsell video-specific software.

  • Global average connection speed grows 2.3% in Q3

    Global average connection speed grows 2.3% in Q3

    The global average connection speed increased 2.3% sequentially and 21% year on year to 6.3 Mbps in the third quarter of 2016, Akamai’s latest State of the Internet report shows.

    South Korea maintained its lead with the highest average connection speed at 26.3 Mbps in the third quarter, but this was down from 27Mbps in Q2, which was itself down 7.2% compared to the first quarter.

    The global average peak connection speed increased 3.4% sequentially and 16% year-on-year to 37.2 Mbps in the third quarter, rising 16% year over year. Singapore continued to have the highest average peak connection speed, at 162 Mbps in the third quarter.

    Meanwhile, global 10 Mbps broadband adoption rose 5.4% quarter over quarter, and 15 Mbps and 25 Mbps broadband adoption rates increased 6.5% and 5.3%, respectively.

    Asia-Pacific region continued to lead the world in average peak connection speeds in the third quarter. Four of the Top 10 countries in average peak connection speeds were from the region.

    Singapore, Hong Kong and South Korea all had average peak connection speeds above 100 Mbps again, with Indonesia close behind at 99.3 Mbps.

    Eleven of the 14 qualifying surveyed Asia Pacific countries/regions posted increases in 15 Mbps adoption, ranging from 3.7% in Singapore to 94% in Vietnam.

    Global average mobile connection speeds meanwhile ranged from a high of 23.7 Mbps in the United Kingdom to a low of 2.2 Mbps in Venezuela.

    “The holiday season serves as one of the true tests of internet connectivity as consumers activate slews of connected devices at the same time and more families are at home collectively pushing their broadband capabilities to the limit,” said David Belson, editor of the State of the Internet Report.

    “The good news is those limits are getting higher as we have continued to observe positive long-term trends in both average and average peak connection speeds around the world. While ‘batteries not included’ may still cause unwelcome surprises, we’re optimistic that connection speeds won’t spoil the holidays this year.”

  • 3 in 4 shoppers demand loyalty rewards from retailers

    3 in 4 shoppers demand loyalty rewards from retailers

    They want more personalised reward programmes, not just the traditional point-based ones. Amidst Singapore’s retail doldrums, more than 75% of Singapore consumers indicate that the will buy more from retailers if they are better rewarded for their loyalty.

    According to a study by ICLP, this is despite the fact that many consumers are currently lukewarm about their relationships with brands and retailers, giving average to low scores in terms of passion, commitment, and intimacy.

    The study noted that only 3% of consumers considered themselves to be devoted to their preferred brands.

    The research suggested that in order for retailers to take their relationships with customers to the next level, they have to go beyond just giving traditional-points based reward programmes.

    “Much like in a relationship with friends and loved ones, they would engage more when they receive genuine gestures that surprise and delight them,” the study explains.

    ICLP country manager Bruno Tay said many Singaporean consumers still relate to brands and retailers at a transactional level, so when times are uncertain, they easily resort to the myriad of choices that are at their disposal.

    “It’s not too late to turn things around, though. In fact, retailers now have a chance to truly stand out if they appeal to the heart too – by approaching communication, reliability, consistency, reward and recognition from a human perspective,” he noted.

  • Fraudulent transactions hitch for e-commerce growth

    Fraudulent transactions hitch for e-commerce growth

    Interbank network provider Artajasa Pembayaran Elektronis says that the popularity of conventional payment methods in e-commerce has made the sector prone to fraudulent transactions, creating potential obstruction to the growth of e-commerce in Indonesia.

    Artajasa information technology (IT) and operation director Bayu Anantasena said in Jakarta on Wednesday that fraudulent transactions happened due to the lack of a payment authentication procedure in conventional payment methods, including bank transfers and cash-on-delivery (COD) payment.

    The company records that 75 percent of Indonesian e-commerce customers make payments through bank transfers, 20 percent through COD and the remaining 5 percent through credit cards and other methods.

    “Fraudulent transactions occur due to a lack of authentication between e-commerce merchants, issuing banks and customers. As e-commerce businesses grow in Indonesia, transaction security becomes more important for their development,” he said.

    The government expects that by 2020, that nation will record US$130 billion in e-commerce transactions, in line with the country’s anticipated digital boom in following years.

    As many as 87 issuing banks are currently using Artajasa’s ATM Bersama network, including Bank Mandiri, Bank Rakyat Indonesia (BRI) and Bank Tabungan Pensiunan Nasional (BTPN).

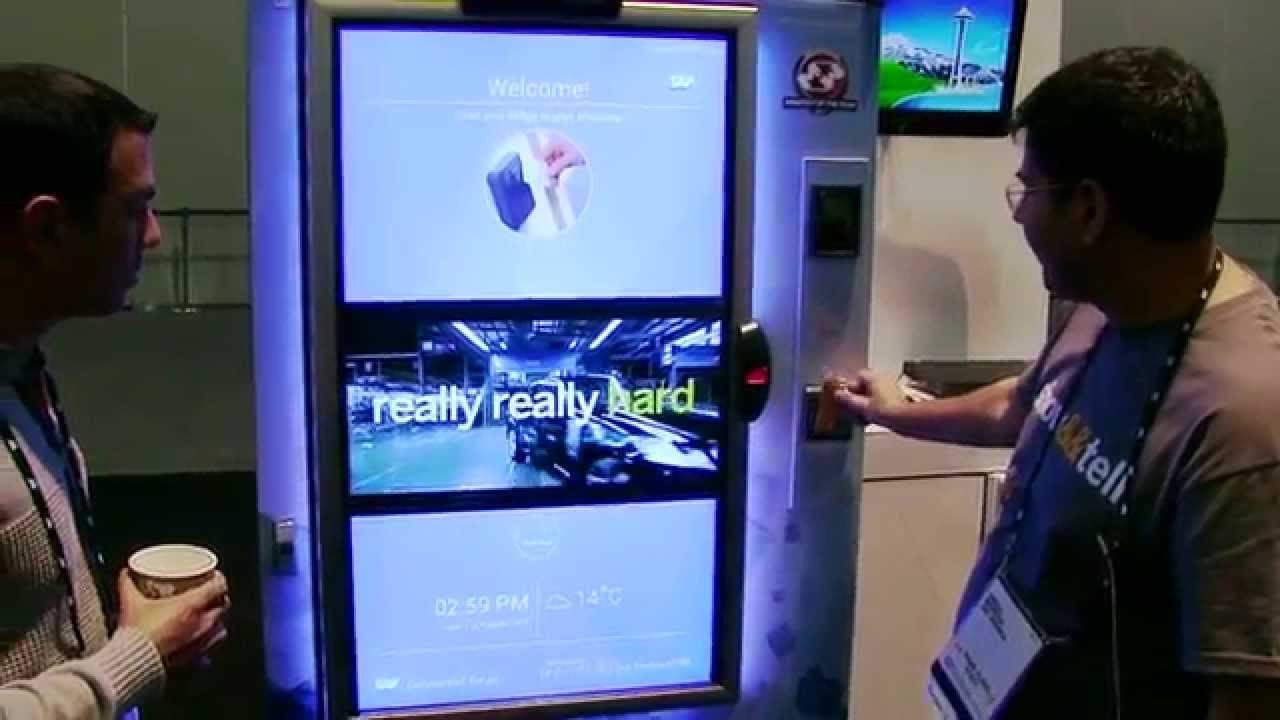
  • Connected vending machines to pass 10m this year

    Connected vending machines to pass 10m this year

    ABI Research estimates that there will be more than 10 million network connections to vending machines by the end of this year, ABI Research estimates.

    The install base is expected to reach nearly 24 million connections in 2021 for a compound annual growth rate of 17%.

    The research firm said the vending machine ecosystem is evolving and companies like Coca-Cola, PepsiCo, and VE Global Vending are looking to expand distribution offerings and connect their machines to the internet to increase operational efficiencies.

    These newly connected machines also allow operators to gain new insight into metrics on inventory management, foot traffic and automatic maintenance requests.

    “The vending machine isn’t dead — it’s just reinventing itself,” said Jeff Orr, Research Director at ABI Research. “There is a point in the near future where the physical and digital worlds will blend to create new experiences. And it’s vendors that optimize their supply chains that will best succeed in this market.”

    VE Global Vending is one company that continuously adapts its strategy to keep pace with evolving technologies, refurbishing used vending machines into digitized versions that include touchscreens, sensor technologies and flexible payment methods.

    ABI Research suggests in a report that there remains room in this market for new players that mirror this methodology and optimize the supply chain to focus on everything from machine manufacturing, placement, and payment solutions to restocking and service.

    “New market entrants have to be creative so that they do not become immediate acquisition targets for brands with broader ecosystem investments,” continued Orr.

    “For instance, the simplest method to connect a vending machine is to use an Ethernet cable to connect it to the building. But new players would be wise to take advantage of the abundance of wireless technology on the market. The question of which party pays for the recurring mobile service costs would still need answering, though.”

    As the connected machines continue to automate services that humans historically addressed, such as key duplication, opportunities will emerge for enterprises to become involved in customized manufacturing and 3D-printing on a small scale.

    “In the coming years, as manufacturers perfect 3D-printing and small-scale machining operations, new services will be possible for producing custom items through a vending and fulfillment experience. The physical and digital worlds are converging—and it’s only a matter of time before their intersection leads to new experiences and opportunities for businesses,” Orr said.

  • Corporate-issued mobile device adoption still low

    Corporate-issued mobile device adoption still low

    Mobile device adoption in the workplace is not yet mature, research from Gartner indicates. Although 80% of workers surveyed by the analyst company received one or more corporate-issued devices, desktops are still the most popular corporate device among businesses, with more than half of workers receiving corporate-issued desktop PCs.

    The survey findings are based on the 2016 Gartner Personal Technologies Study, which was conducted from June to August 2016 among 9,592 respondents in the US, the UK and Australia.

    Thirty-six percent of workers received laptops, including convertible laptops. Adoption of convertible laptops as a corporate-issued device is still very low, but has been gradually increasing.

    Gartner analysts expect that more employees will receive convertible laptops in the next three years, driven by the Windows 10 refresh that can enhance the user experience with touch-based input. Adding desktops and laptops (including convertible laptops) together, 75% of workers will receive at least one PC-type device in mature countries.

    In contrast to the high numbers of corporate-issued PCs in the workplace, relatively few workers receive mobile devices. The majority of smartphones used in the workplace are personally owned devices — only 23% of employees surveyed are given corporate-issued smartphones.

    “The low adoption of corporate-issued mobile devices underlines the fact that large numbers of personally owned mobile devices are used in the workplace,” said Mikako Kitagawa, principal research analyst at Gartner. “In fact, more than half of employees who used smartphones at work rely solely on their personally owned smartphones.”

    The usage rate of personally owned tablets lags behind that of personally owned smartphones. Only 21% of employees use tablets — regardless of whether they are corporate issued or personally owned.

    “In the era of mobility, it comes as something of a surprise that corporate usage of smartphones and tablets is not as high as PCs, even when the use of personally owned devices is taken into account,” said Kitagawa. “While it’s true that the cost of providing mobile devices can quickly escalate, proper usage of mobile devices can increase productivity, which can easily justify the extra costs.”

    When employees are provided with corporate-issued devices, they are generally happy with the devices that they receive. Less than 20% of respondents said they were dissatisfied with their employer-provided devices. The satisfaction level is higher with tablets and smartphones compared with desktop and laptops.

    “Usage of personally owned devices in the workplace is nothing new, but the survey results confirm that this trend has become a new workplace standard. Two-thirds of survey respondents said that they use a personally owned device or devices for work,” said Kitagawa.

    “Smartphones and phablets are the most popular personally owned devices used for work, with 39% of employees using them, compared with just 10% who are only using corporate-issued smartphones and phablets.”

  • Internet freedom shrinks globally in 2016

    Internet freedom shrinks globally in 2016

    Internet freedom around the world declined for the sixth consecutive year, according to the Freedom on the Net 2016 report released recently by Freedom House.

    The US government-funded advocacy group has published Freedom on the Net 2016, which assesses internet freedom in 65 countries, accounting for 88% of internet users worldwide.

    For the second consecutive year, China was the world’s worst abuser of internet freedom, followed by Syria and Iran, the report asserts.

    An amendment to Chinese criminal law added seven-year prison terms for spreading rumors on social media (a charge often used to imprison political activists). Some users in China belonging to minority religious groups were imprisoned for watching religious videos on mobile phones.

    Globally, the study found that two-thirds of all internet users (67 percent) live in countries where criticism of the government, military, or ruling family was subject to censorship. Governments in 24 countries also impeded access to social media and communication tools, up from 15 in the previous year. Moreover, authoritarian countries most frequently blocked access to these tools during political protests.

    “Popular social media sites like Facebook and Twitter have been subject to growing censorship for several years, but governments are now increasingly going after messaging apps like WhatsApp and Telegram. Messaging apps are able to spread information quickly and securely — and some governments find this threatening,” said Sanja Kelly, director for Freedom on the Net.

    “Jailing of internet users led to a significant chilling effect in many countries under study. When authorities sentence users to long prison terms for simply criticizing government policies online, almost everyone becomes much more reluctant to post anything that could get them in similar trouble.”

    Meanwhile, digital petitions or calls for protests were censored in more countries than before, as were the views of political opposition groups and the LGBTI community. Nearly half (47%) of internet users live in countries where alleged insults to religion can lead to censorship or arrest.

    Image-sharing platforms were blocked, and world leaders took strong action when their photos were mocked on social media. In Egypt, a photo depicting President Abdel Fattah al-Sisi with Mickey Mouse ears resulted in a three-year prison term for the 22-year-old student who posted it on Facebook.

    “When faced with humorous memes and cartoons of themselves, some world leaders are thin-skinned and lash out” said Kelly. “Instead of enjoying a good laugh, they try to remove the images and imprison anyone posting them online.”

  • Digital ads reach across APAC for 18-34 year olds improving

    Digital ads reach across APAC for 18-34 year olds improving

    The success rate of digital advertising campaigns in reaching their intended audiences has lifted significantly within a number of demographic groups across Asia Pacific, in particular for the highly sought-after 18-34 year old segment, as advertisers and their media agencies become more adept with media planning and buying, according to a new benchmarking study of the global digital advertising landscape by Nielsen.

    The Nielsen Digital Ad Ratings Global Benchmarks study, which assessed more than 47,000 digital campaigns across 17 countries in North America, Europe, Latin America and Asia Pacific, found that across Asia Pacific, digital advertising campaigns intended for consumers aged 18 to 34 years had the highest on-target success rate, with 63% of the advertising destined for these consumers hitting the mark, up from 53% in 2015.

    Campaigns aimed at females within the 18- to 34-year-old age group experienced the highest lift in on-target reach, posting a 15-percentage-point improvement to 51%.

    “The Nielsen Digital Ad Ratings benchmark report is shining new light for advertisers on how their digital advertising campaigns are faring in comparison to industry norms,” said Annette Kunst, managing director for Media at Nielsen Singapore.

    “The year-on-year performance improvement shows that an increase in independent measurement can lead to more transparency, and that ultimately improves overall reach and ad spend efficiency,” said Kunst.

    Across platforms, advertising served up via desktop still outperforms mobile advertising when reaching broad audience segments. Desktop advertising intended for people aged 18 to 49 years achieved a 70% on-target success rate, compared to 66% for mobile.

    Conversely, for more niche audiences or narrower segments such as the 18- to 34-year-age group, mobile has a higher success rate – 65% of mobile ads hit their mark, compared to 61% for desktop.

    “Mobile’s success reaching more narrowly defined audiences reinforces that mobile devices provide a highly personalized platform with the potential for more precise connections, and that’s reflected in the rapid increase we’ve seen in mobile advertising, where 45% of the digital advertising campaigns we measure today across Asia Pacific include a mobile component,” said Kunst.

    “With increasing media fragmentation, marketers need to consider all the screens at their disposal when trying to reach their audience,” she said. These benchmarks can help media buyers and sellers better evaluate total digital reach.”

    Looking across categories, Computer & Electronics and Travel marketers had an easier time reaching their desired audience, achieving an on-target success of 68% and 67% respectively. The Automotive and CPG sectors highlight opportunities to optimize reach and maximize return on ad spend, with 47% and 43% of digital ads respectively reaching their intended audience.

  • Thailand’s green material Industry and the green building trend

    Thailand’s green material Industry and the green building trend

    In the midst of today’s environmental movement, green buildings (buildings designed to be environmentally friendly through more efficient use of resources) are popping up more and more in Thailand.

    Using data from green building credentialing bodies like the U.S. Green Business Council (USGBC), which developed the Leading in Energy & Environment Design (LEED), and the Thai Green Building Institute (TGBI), which developed Thailand’s Rating of Energy and Environment Sustainability (TREES), EIC found that the number of certified green buildings and buildings in the process of accreditation in Thailand has risen substantially, increasing from six buildings in 2007 to 243 buildings in 2015.

    With EIC’s estimate of 294 green buildings in 2016, the average annual growth rate for green buildings in Thailand is 54%. Thailand’s green building area increased from 40 thousand square meters in 2007 to 4.3 million square meters in 2015, and it is estimated that it will reach 5.0 million square meters by the end of 2016, pushing average growth to 71% per year (Figure 1).

    Green buildings in Thailand consist of office buildings (around 40%), retail stores and shops (around 30%), and other structures such as factories, residential buildings, hotels, and schools (around 30%) (Figure 2).

    Although the costs of building green are higher than construction costs for conventional buildings, it is the benefits they offer that are responsible for the expansion of green structures today.

    The average cost of building green in Thailand is 20,700 baht per square meter, which is about 5.2% higher than the average conventional building cost of 19,700 baht per square meter (Figure 3).

    This is because building green involves more restrictions in choosing materials and in designing building systems, as well as additional fees for obtaining LEED or TREES credentials. However, owners can gain both monetary and non-monetary advantages from green buildings. Monetary benefits include a decrease in building management expenses like electricity and water costs that can be reduced by 10% or around 90 baht per square meter per year, and up to about 21% or 180 baht per square meter per year by the fifth year after the completion of the project (Figure 4). These numbers are comparable to the decrease in energy costs of  well-known green building Energy Complex.

    The Energy Complex building contains 192 thousand square meters of utility space and has reduced building management costs per year by about 28 million baht, or about 146 baht per square meter per year.  Another monetary advantage for green building owners is increased rents. Rents for green buildings are around 30% higher than those of conventional buildings in the same area, or about 230 baht per square meter per month (Figure 4). Non-monetary benefits include significantly higher worker productivity in green buildings compared to conventional buildings, deduced from sick day records and illnesses caused by sick building syndrome.

  • Over half of APAC connected consumers use m-payment

    Over half of APAC connected consumers use m-payment

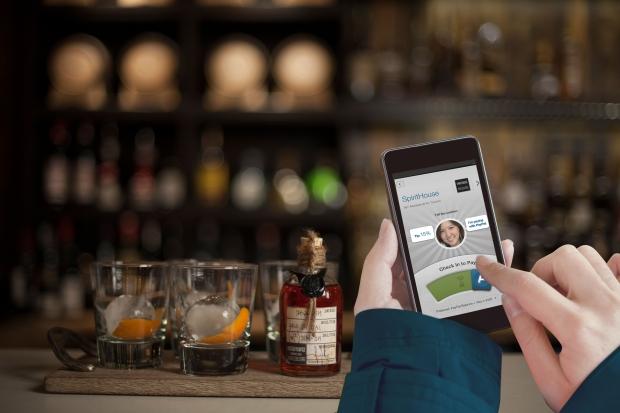
    The Asia Pacific region is leading the world in mobile payment adoption, with over half of connected consumers in the region using their mobiles to pay for goods or services at point of sale via apps.

    This is among the key findings of a survey of more than 70,000 consumers, conducted by consultancy Kantar TNS. The study pegged mobile payment penetration for Asia Pacific at 53%, compared to 33% in North America and 35% in Europe.

    With smartphone users across Asia Pacific numbering over a billion, one key driver behind this trend would be the significant mobile penetration here. Moreover, the evolution of Asian chat apps to include payment options and the lack of legacy banking structures has only served to accelerate adoption.

    Chat apps such as WeChat and LINE have developed numerous payment services such as WeChat Pay, Line Pay, Alipay and O! ePay to facilitate everything from taxi bookings to e-commerce sales.

    Mobile payment options within these apps allow consumers to complete their purchase journey seamlessly, and also serve to help to establish these behaviors.

    Many mobile-first markets such as India, Malaysia and Indonesia are also taking up the behavior, fueled by the lack of legacy banking structures. The study noted that this makes that mobile payment an especially attractive solution for connected consumers in these countries.

    China, Hong Kong and South Korea are the top three mobile payment markets globally for weekly use, while Singapore is in the fourth position with the use of mobile payment identified as most prevalent among middle-aged consumers.

    In Singapore, 57% of connected consumers have used mobile payment, with more than a quarter (27%) doing so on a weekly basis. This number rises among younger Singaporeans ages 16-30, where 31% use mobile payment weekly, but is highest (33%) amongst middle-aged consumers in the 31-45 age group.

    Only 11% of those ages 46-65 use mobile payment on a weekly basis, however, 37% have tried it in the past, showing that they are open to sampling this kind of new technology.