Category: Research

Retail News Asia is committed to providing both local and global retailers with the latest Research throughout the Asian market. This on a daily base.

  • Global Threat Index shows rise in malware attacks

    Global Threat Index shows rise in malware attacks

    The number of malware attacks increased in October, according to Check Point Software’s monthly Global Threat Index.

    Check Point’s Threat Intelligence Research Team found that both the number of active malware families and number of attacks increased by 5% during the period, pushing the number of attacks on business networks to near peak levels, as seen earlier this year.

    Locky ransomware attacks continued to rise, moving it up from third to second place, while the Zeus banking trojan moved up two spots, returning it to the top three.

    The reason for Locky’s continued growth is the constant variation and expansion of its distribution mechanism, which is primarily through spams emails. Its creators are continually changing the type of files used for downloading the ransomware, including doc, xls and wsf files, as well as making significant structural changes to the spam emails.

    The actual ransomware itself is nothing exceptional, but cyber criminals are investing a lot of time into maximizing the number of machines that become infected by it.

    For the seventh consecutive month, HummingBad, an android malware that establishes a persistent rootkit to carry out an array of malicious purposes, remained the most common malware used to attack mobile devices.

    Once again Conficker retained its first place position as the world’s most prevalent malware, responsible for 17% of recognized attacks. Both second placed Locky, which only started its distribution in February of this year, and third placed Zeus, were responsible for 5% of known attacks.

    “With the number of attacks and malware families increasing, the scale of the challenge organizations face in ensuring their networks remain secure is tremendous,” Check Point head of threat protection Nathan Shuchami said.

    “It is particularly concerning that a malware family as established and well known as Conficker is so effective, suggesting that organizations aren’t using the latest, multi-layered defenses.”

  • Digital payments fueling FinTech investments in APAC

    Digital payments fueling FinTech investments in APAC

    The APAC FinTech landscape is witnessing unprecedented growth, with FinTech solutions and services expected to gross more than $70 billion in revenue by 2020.

    Market research firm Frost & Sullivan believes the market is on track to record a CAGR of 72.5% over this period.

    “Asia-Pacific FinTech investment increased exponentially in 2015. There was a four-fold increase of investments in APAC FinTech companies from 2014 to 2015 which shows growing investor confidence in the Asia-Pacific region. Meanwhile 42% of the investment deals concentrated on digital payments,” Frost & Sullivan VP for digital transformation Ajay Sunder said.

    Innovation hubs have formed around Hong Kong, Singapore and Sydney riding on the back of favorable government regulations, strong start-up ecosystems and heavy consumer demand among the 18-34 demographic group in particular.

    The emergence of new business models is enabling players to innovate and invest in technologies such as Blockchain, digital payments, cloud services, cyber security, product lines and solutions. Players must rethink strategies and align their business vision with technology goals to define their value proposition to customers and survive in the rapidly evolving digital ecosystem.

    “Digital payment will remain the largest segment, primarily driven by mobile payment solutions, while Blockchain will not remain limited to financial services; there will be new use cases for Blockchain, and traditional ICT vendors will start offering Blockchain-as-a-Service,” noted Sunder.

    Frost points to innovative services providers such as BitSE, Canopy, Coinsecure, DxMarkets, Freecharge, HedgeSPA, MOLPay, Otonomos and TranServ as addressing unmet needs, embracing new technologies and gaining a disruptive advantage by leveraging diverse opportunities.

  • China becomes top iOS App Store market in Q3

    China becomes top iOS App Store market in Q3

    China set new record in the third quarter for the highest iOS App Store revenue to date for any country, according to App Annie’s Market Index Report for the period.

    With total revenues of $1.7 billion, China overtook the United States by over 15% and its growth is projected to climb further by 2020.

    The Q3 2016 Market Index Report also showed that China maintained its spot as No. 1 for Games category as it accounted for the majority of the generated revenue.

    Other prominent categories making strides are Entertainment and Social Networking, which have more than tripled in the past year. Video streaming apps (like iQIYI, Tencent Video and Youku) in China have had a major impact on the Entertainment category as a whole.

    Pokemon Go was cited as the stand-out app of the year, racking up $600 million in customer spend faster than any app to date. It also outpaced the extremely successful Clash of Clans by more than 6.2 times in under three months.

    Pokemon Go has also converted a massive amount of a user’s non-mobile time to mobile time as its innovative AO gameplay and iconic IP were compelling enough to convince users to spend more time overall on their mobile devices. It has altered the playing field as it introduced augmented reality to the masses and paved the way for future AR and VR opportunities in the app stores.

    The revenue of Entertainment apps strengthened in the third quarter and it has grown substantially in both iOS App Store and Google Play. This is largely due to the popularization of in-app subscriptions as a monetization method driven by video streaming.

    With revenue more than tripling since the third quarter of 2014, people are not only using their mobile devices to stream content but also as a common form of payment.

    This represents a significant shift from traditional broadcasting and television structures where users typically enter into a contract with a cable provider.

  • Best seats in business class: Singapore Airlines Boeing 777-200ER

    Best seats in business class: Singapore Airlines Boeing 777-200ER

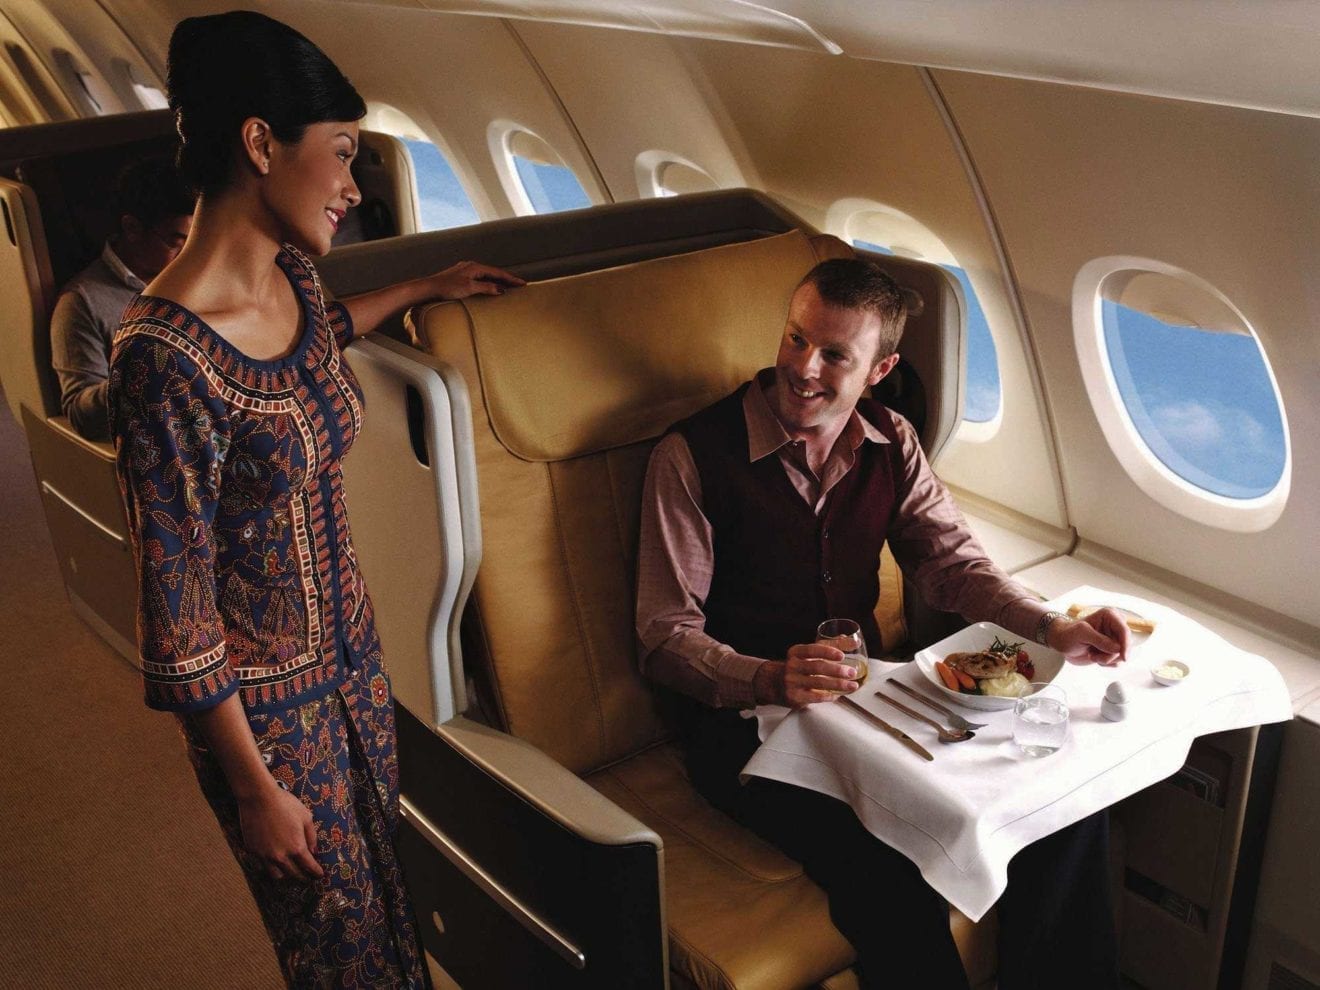
    Business class on Singapore Airlines’ refitted Boeing 777-200ERs proves almost identical to what you’ll get aboard the airline’s flagship Airbus A380s, but with a few tweaks and touches to maximise your space for sleeping and working.

    Now gracing Australian skies on overnight flights from Brisbane to Singapore – and planned also for flights between Sydney and Jakarta – here are our top seating picks in business class, whether you’re aiming to work through the flight, catch some shut-eye or chat with your partner.

    Singapore Airlines refitted Boeing 777-200ER business class: the basics

    Singapore Airlines spreads 26 business class seats across the first seven rows of its refitted Boeing 777-200ERs, configured in a 1-2-1 layout that places the ‘A’ and ‘K’ seats by the windows and the ‘D’ and ‘F’ seats in the centre:

    Even though there’s no first class cabin, business class begins at row 11 and also skips the ‘unlucky’ row 13, with all seats found together within a single ‘zone’ of the aircraft.

    Note that Singapore Airlines’ other, non-refitted Boeing 777-200ERs instead feature a different type of business class seat and use a different layout also, for which this guide does not apply.

    Singapore Airlines refitted Boeing 777-200ER business class: best seats

    For sleeping – 11A, 11K: While every business class seat here transforms into a fully-flat bed, the window seats in the first row provide considerably more space both beside and in front of you, as there’s no narrow ‘foot cubby’ to contend with.

    Instead, you can spread out as you wish, which taller travellers will particularly appreciate:

    If 11A and 11K are already taken or otherwise unavailable, look to 11D or 11F instead – also with extra foot space, but not as roomy:

    Also note that 11A & 11K double as bassinet seats, so if there’s a baby-toting traveller on your flight and you’ve perched yourself here, there’s a chance you may be moved to accommodate them.

    For productivity – other A, K seats: Those bulkhead seats above certainly are spacious, although they lack many of the storage nooks afforded to passengers in the other rows.

    On daytime flights when you’re planning to work, we’re sure you’ll appreciate this extra storage bin – handily located near the USB and power outlets for convenient charging of your devices…

    … as opposed to your only at-seat storage option in those bulkhead seats: a literature pocket that already comes filled with literature:

    For couples – the D + F pairs: When travelling with your significant other, aim for one of the seven centre pairs.

    You’ll need to lean forward slightly to see each other when sitting upright, although with each seat measuring 30 inches wide, one traveller could certainly visit the other’s seat while enjoying a movie – there’s even a second headphone outlet at these seats to make this easy.

    If you’re a solo traveller and can’t snag a window seat, don’t fret – there are two sturdy privacy dividers which can be opened in between, so that even if one passenger retracts theirs, the other can remain in place.

    Avoid 18D, 18F: Found in the very back row of business class, these seats are practically next to the main aircraft door used for boarding economy passengers (18D even more so than 18F), and what’s more, the two business class restrooms are located directly behind.

    That severely limits your privacy both on the ground and in the air with so many passengers passing by these seats, not to mention the extra noise from the lavatories.

    Instead, as there are no restrooms ahead of business class – only rearward, behind these seats – you’ll find greater privacy in a row further forward instead.

  • Smartphones can help India’s drive for cashless economy

    Smartphones can help India’s drive for cashless economy

    India is currently the largest growing market for smartphones and it is estimated that the number of smartphones sold in the country is very likely to be greater than 100 million in 2017.BEIJING: As India embarked on cashless economy with demonetisation of high value notes, smartphones could help in the country’s de-cashing drive like in China where online payment through phones have become order of the day, Chinese media said today.

    “While India is implementing the government-led de-cashing via demonetisation, China is experiencing a rapid market based de-cashing process via the digitalisation of transactions on the online or mobile payment platforms,” an article in the state-run Global Times said today.

    In the most recent 11/11 (Singles Day) online shopping day, consumers spent 120.7 billion yuan (USD 18 billion) on Tmall, the largest business-to-customer shopping website in China, with all transactions settled via Alipay, the online payment platform set up by Alibaba Group, the article said.

    “Meanwhile, Alipay and WeChat Pay (the online payment platform of WeChat by Tencent) are widely accepted by restaurants, shops and even grocers throughout the country,” it said.

    The high ownership rate of smartphones in China may explain this rapid digitalisation in transactions, it said, citing a recent survey by Pew Research Centre, which said smartphone ownership rate is 58 per cent in China, 37 per cent in Japan and 17 per cent in India.

    “This high ownership rate plus a relatively slow growth rate in credit card ownership has led to the ‘leapfrog development’ of de-cashing in China,” the article said.

    “Compared to traditional bank transfers, online payment systems are usually more convenient and user friendly. Hence, market-based de-cashing faces much less resistance than other types of de-cashing,” it said.

    “India is currently the largest growing market for smartphones and it is estimated that the number of smartphones sold in the country is very likely to be greater than 100 million in 2017,” it said, pointing to high sales witnessed by Chinese phone makers like Xiaomi.

    “If India would like to try the Chinese style of de-cashing through online/smartphone payment, it is very likely to be beneficial to both countries,” it said.

  • Starbucks in Cambodia: From Coffee Beans to Housing Dreams?

    Starbucks in Cambodia: From Coffee Beans to Housing Dreams?

    There’s nothing particularly new with coffee places opening in Phnom Penh. There is a different brand of coffee shop at just about every corner.

    But the recent launching of the Starbucks Reserve brand in Phnom Penh seems to mean something significantly more for both the international F&B franchise sector, and local urbanite Phnom Penh citizens.

    Been There, Done That

    With 45 years of experience in the coffee industry, Starbucks has managed to open around 22,519 stores worldwide (as of June 28, 2015). The brand has become one of the world’s most recognized, through intensive advertising campaigns and aggressive product placement.

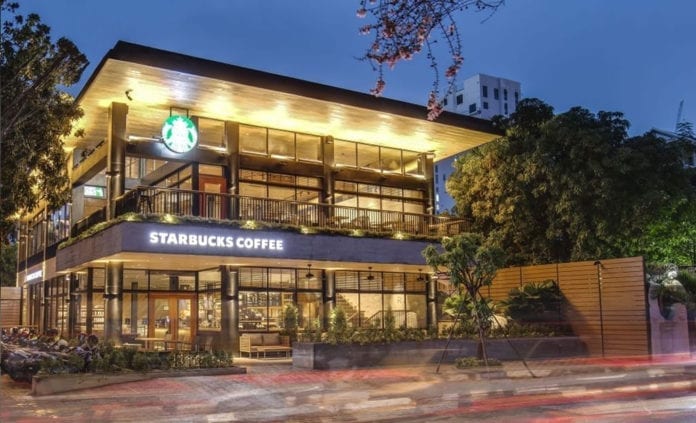
    Fast-forward to October of 2016, another branch just opened to serve the Cambodian public in Phnom Penh’s BKK1 district. It was launched under the high-end “Reserve” brand of the company.

    If the market can prove profitable for Starbucks, other international F&B and consumer goods franchises may look to enter the Cambodian market place as well

    The new branch features two floors and 650 square meters filled with local craftsmanship, including a mural centerpiece depicting the Cambodian Folklore of Sovann Maccha.

    Starbucks Cambodia has partnered up with a local NGO – Cambodian Children’s Fund – as part of its long-term community investment. They said, “We take a thoughtful, disciplined approach to growth in Cambodia that is locally relevant and in line with our company’s values. Our growth story is not just about expanding our store count in the market.”

    Something Brewing:

    Yet Starbucks’ opening of another high-end coffee place doesn’t only signal a positive outlook for the F&B industry…

    It also transcends into real estate. A few months back, the World Bank declared Cambodia a lower-middle income country – where Cambodians currently have an average yearly income of between $1,026 and $4,035.

    So, locals are now able to afford items that have a higher price tag, according to the Bank.

    With this rise in consumers’ expendable incomes, Starbucks isn’t worried about the huge difference in price of their coffee compared to local ones. The local coffee costs about $0.74 (and sometimes as cheap as $0.25), while a small latte from Starbucks is $2.95.

    If a cup of coffee is any indication of rising incomes, then sectors like real estate might follow a similar trend. Investors may be getting closer to a market in which the local population can afford resale units and higher rental rates. The current lack of a secondary market, resale and rental, for new development units is proving one of the biggest risks of the Cambodian market for pure investors.

    Furthermore, if the market can prove profitable for Starbucks, other international F&B and consumer goods franchises may look to enter the Cambodian market place as well – spurred by this signal of consumer confidence and affluence.

    So while Starbucks opening in BKK1 has been warmly welcomed by local cafe enthusiasts keen to try an international flavor, its significance for investors may have longer lasting influence.

  • 7 Tips To Gain More Followers On Instagram For Retail Businesses

    7 Tips To Gain More Followers On Instagram For Retail Businesses

    Retail businesses often don’t know where to start when it comes to getting an Instagram account set up for their sites. However, there are a number of great things you can do to ensure you start off on the right foot.

    So you wish to gain more followers for your Instagram account? These tips are here to help

    Make a Brand Story to Connect with People

    Instagram was created to help users connect with others things they are interested in. Keep in mind that the brand is not just the object that it is meant to sell and Instagram is one of the best places to bring that out. One of the ways to take advantage of Instagram is to share photos that embody the brand lifestyle. Do not limit yourself to sharing photos of only your products.

    These photos showing the lifestyle represented by your brand will help in enhancing the appeal of your brand to potential customers who may not necessarily have looked at the photo of your products and help them show how your brand fit in their lives.

    This is not the only benefit of sharing photos other than your products. Do not forget that Instagram personalizes their users’ feed. The new update of the app has also made it more difficult for brands to show the users things they don’t like by updating the timeline style to the best comes first from chronological. In other words, it also means that your photos will have the potential to get more likes and appear in the feeds of more followers in case you are successful in showing what your brand represents.

    Instagram Was Created to Connect with Others

    Share with others the inside photo of your shops and how the products are being made. Instagram service Vibbi advises that you share pictures of your CEO working. Help your customers connect with you. Your customers are also interested in knowing the people behind the company. Sharing their efforts through high-quality images can be used for showing what your company stands for. For instance, if your company likes to do good deeds or donate, these should be shared on your Instagram.

    Young consumers these days also find it important to give back. Take the example of Toms. While this tip may seem similar to the tip given above, the major difference is that the above mentioned tip is focused on showing what your brand represents whereas this tip is more about giving a human face to your company and brand.

    Take Advantage of the Events

    One of the best ways to take advantage of Instagram is to take advantage of the big events such as the World Cup or Fashion Week. Share some images which tie your brand to these events. For instance, a hat shop can certainly take advantage of the Kentucky Derby Day by sharing photo of their employees wearing different types of hats to #DerbyDay. In simple terms, the end goal is to connect with the audience on the platform and clearly showing your followers your place in their world.

    Use the Existing Foundation to Grow Your Fan Base

    Use your existing fans to grow the number of followers. Ask them to post photos with items they have already bought from you. This will lead to their friends seeing your brand in their feed and they will be curious to know what’s up and if they find your feed interesting, they may also follow you. In other words, it will boost your brand’s credibility as the reviews are very important.

    Another way to use your existing fans is to organize promotional contests on Instagram. Ask your existing customers to share photos of the products they have bought from your store with a certain hashtag and also to tag your store. Give an awesome prize to the chosen winner.

    Location Tags and Hashtags Are a Must

    You will get many more views on your feed if you regularly use location tags and hashtags, especially if they are relevant. Do search for hashtags with around 500 to 1000 posts. It should have enough posts which means people are looking at the feed with this hashtag but the posts should be limited as overwhelming number of posts may lead to your post being lost in the sea of all the other posts.

    Hashtags are also great because it makes everyone searching for that hashtag a potential customer and not just the people who are already aware of your brand. For instance, a user from India who has never known me or known someone who knows me can also find me by searching for a specific hashtag feed that also includes my post.

    Instagram for Retail

    Have fun with hashtags and break them down. For instance, break up #bohostyle in to #style and #boho. It’s fine even if it looks repetitive. Also, mix specific hashtags with generic hashtags. As a clothing retailer, using generic hashtags such as #style in your posts will help you get maximum views but using specific hashtags such as #beachdress will also get you views from people who are interested in that particular hashtag.

    Location tags are extremely important for brick and mortar stores. With the help of location tags, people near your store (who are currently looking at their location feed which includes all the posts from places near that user) will also be able to find you. Location tags may inspire a customer who is sipping coffee next door to drop in to your store and by that thing they just looked at. Using location tags also puts your location in the customers’ heads.

    Your Profile Should Be Consistent and Close to the Store Name

    By having a consistent profile, you will make it easy for fans to find you on Instagram. Also, once they have located you on Instagram, it will be easier for them to find your brand on Facebook, Twitter and other places in case you use the same bio, photo and username.

  • Singapore shoppers look to online shopping for good deals

    Singapore shoppers look to online shopping for good deals

    The extended season will lead to an eleven percent ($9.1 billion) increase in online sales to a total of $91.6 billion, according to Adobe’s 2016 Digital Insights Shopping Predictions report. Large retailers expected to account for the bulk of the growth, with an average growth rate of 16.6% compared to smaller retailers at 7%.

    “We expect to see a five percent spike in online shopping in early November and a record 24 percent increase in the last two weeks of December,” said Mickey Mericle, the vice president of marketing and customer insights at Adobe.

    “‘Click and collect,’ faster shipping and retail promotions starting earlier than ever are all contributing to the extended shopping season. Despite the uptick in sales we expect to see slower growth in total online sales this year,” he says.

    Singapore shoppers

    Closer to home, findings specific to the Singapore market show that consumer budgets are tight and the savvy shopper prefers online shopping due to the higher likelihood of finding good deals and bargains this way.

    Marketers can also expect fewer last-minute shopping rushes as respondents are now shopping slightly earlier in November. This suggests that marketers should make the effort to reach out to these early birds accordingly.

    Notably, consumers report visiting an average of 3-5 sites before making a purchase, which offers marketers a critical chance to target these potential customers once more and bringing them back on-site via remarketing

    Almost half of Singaporean millennials (49%) surveyed value experiences more than material goods, with a sizeable 41% echoing this sentiment when all local consumers who are surveyed are factored into the picture.

    Finally, the study shows that mobile shopping is king as consumers praise retailers for better optimizing their sites for mobile browsing, allowing them to shop on the go with their hectic schedules.

  • With close to 55%, Japan has highest mobile commerce transactions

    With close to 55%, Japan has highest mobile commerce transactions

    Mobile commerce conversion rates are highest in Japan, the U.K and South Korea for Q2 2016 states the State of Mobile Commerce Report released by performance marketing technology company, Criteo. The company claims to have studied 1.7 billion transactions across desktop and mobile sites worth $720 billion in annual sales, covering over 3,300 online retail businesses for this report.

    Global numbers

    • Mobile Vs Desktop: With close to 55% of its retail commerce transactions done through mobile phones, Japan tops the list of countries in the world with the highest mobile retail commerce transactions for Q2 2016 followed by United Kingdom and South Korea with a little over 50% and 48% of its retail commerce transactions, respectively.
    • Smartphone Vs Tablet: For the first time, smartphones have superseded tablets delivering majority of the mobile commerce transactions. South Korea recorded over 95% of its mobile retail commerce transactions were done through smartphones while Japan and Brazil recorded close to 90% and over 80% of its mobile retail ecommerce transactions through smartphones, respectively.
    • Apps Vs Mobile Web: According to the report, apps convert 3x more than mobile website in Q2 2016. Globally, 54% of the transactions were driven through mobile apps while 46% of the transactions were driven by mobile web in Q2 2016.
    • According to the report, new app users are twice as likely to return within 30 days vs. mobile web users.
    • Average order value higher on apps vs mobile web: $127 seems to be the average order value on apps compared to $91 and $100 on mobile web and desktops respectively.
    • Apps’ conversion rates highest: The conversion rate for transactions is highest on mobile apps (3x) followed by desktop (2x) while mobile web is the lowest.
    • Mobile-friendly websites aid higher transactions: According to the report, countries with mobile-friendly websites seem to have the greatest share of mobile transactions. With close to 90% mobile-friendly websites, Japan has over 50% mobile transactions followed by U.K with little over 85% mobile-friendly websites and nearly 50% mobile transactions. In the third place, with over 95% mobile-friendly websites, South Korea has close to 50% mobile transactions.
    • Leading retailers vs Emerging retailers: The report also notes that leading retailers that succeed retaining users and attracting views drive 39% more mobile web conversions more than emerging retailers. The report defines leading retailers as mobile app that attract more products browsed per user than lower tiers while emerging retailers are mobile-commerce enabled apps that are accessible via at least one operating system.

    U.S Market

    • In Q2 2016, Android has a market share of 68% superseding iOS (31%) although iOS continues to generate the maximum number of mobile commerce transactions done on smartphones with 14.6% compared to Android devices (8.8%).
    • In the same quarter, 70% of mobile commerce transactions were done on smartphones compared while the remaining was done on tablets.
    • Contributing over 40% to mobile commerce transactions in the U.S, fashion and luxury retail is the category with the highest number of transactions in the quarter followed by Mass Merchants (close to 40%) and Health & Beauty (30%).
  • How Asia-Pacific is driving global online retail

    How Asia-Pacific is driving global online retail

    The world’s largest and most populous continent, Asia is made up of 48 countries and spans 44,579,000 square kilometres. With a widely diverse population of 5.096 billion people, the continent’s rich historical background offers a wealth of opportunities to explore, from the untouched steppes of Central Asia to the bustling economic centres of China and Japan. Iconic sights such as the Taj Mahal and the Temples of Angkor Wat may draw tourists from around the world, but strong economic growth and up-and-coming markets are providing new footholds for businesses and investors alike.

    The key e-commerce markets in the Asia region are China, India, Indonesia, Japan, Malaysia, Philippines, Singapore, South Korea, Thailand and Vietnam. Together, these countries represent 86 percent of all e-commerce turnover in the Asia Pacific region, a figure which rises to 90 percent when Oceanic countries such as Australia and New Zealand are excluded.

    E-commerce in Asia is flourishing – with $770 billion in transactions annually, the Asia-Pacific region leads the world. An expanding middle class, growing Internet penetration and improving infrastructure means the region will continue to drive global online retail over the next five years.

    Access to financial services is a key stimulus for e-commerce. A lack of banking infrastructure in many countries in the region is exacerbated by barriers caused by geographical and physical access to banking services. Increased Internet penetration will aid in removing these barriers, but with some areas having an account penetration of as low as 2 percent, many countries will continue to rely on cash as the main method of payment for some time to come.

    While, on average, 51 percent of the region’s population has access to an account with a financial institution, the extremely low income level of a significant proportion of the population results in a high overall percentage of unbanked people. In spite of its growing middle class, China’s traditional rural economy and vast territory results in the country accounting for more than 12 percent of the world’s unbanked population.

    The expanding middle class is making a significant contribution to the growth of e-commerce across the Asia region. This group is expected to reach 1.7 billion by the year 2020, with China, India and Indonesia experiencing the greatest growth. With the increase in the number of options that e-commerce brings, consumers are also showing marked personal preferences. This, in turn, is leading to increased competition, with traditional retailers moving to having an online presence (either individually, or by using an online marketplace), and local businesses experiencing pressure from regional and global brands which want a share of the growing sector’s profits. Again, China is a leading force in both the regional and global economy.

    Technology, naturally, is a major factor in changing economic patterns, with internet penetration playing a significant role. Notably, in spite of having the highest B2C e-commerce sales of any region in 2014, Asia has the lowest penetration of all regions globally (although Japan, Singapore and South Korea fall into the global top ten). As infrastructure becomes more ubiquitous, e-commerce will continue to experience high growth as a result; countries with a low penetration rate, such as India, with only 18 percent, are expected to drive future growth.

    The young are traditionally the first to embrace new methods of doing anything, and it is no different in Asia. Millennials are the most active group online, and use social media as their preferred form of communication – Facebook has more than 270 million active daily users in Asia alone. This familiarity with the online environment results in a willingness to embrace cashless payment methods, and this group exhibits different patterns of consumer behaviour to other demographics.

    The use of online payments varies throughout the region according to how developed the local market is. The more mature the market, the more likely it is that consumers in the country will use cards in order to pay for online purchases: for instance, in Japan and South Korea, 63 percent and 83 percent of online purchases respectively are paid by card. In contrast, emerging markets such as India and Malaysia continue to prefer cash based payment methods.

    In China, E-wallets are the most popular form of payment online, being used for 48 percent of transactions. Whereas, in Indonesia, e-wallets and other forms of payment are the least preferred methods, making up 5 percent and 3 percent of transactions respectively. There, bank transfer is used in 39 percent of e-commerce transactions, with card-based purchases accounting for 29 percent.

    The trend, though, we are seeing overall is that cash based payments are increasingly being displaced by electronic payment methods throughout the region.

  • Tax free shopping spend drops in Asia and Europe

    Tax free shopping spend drops in Asia and Europe

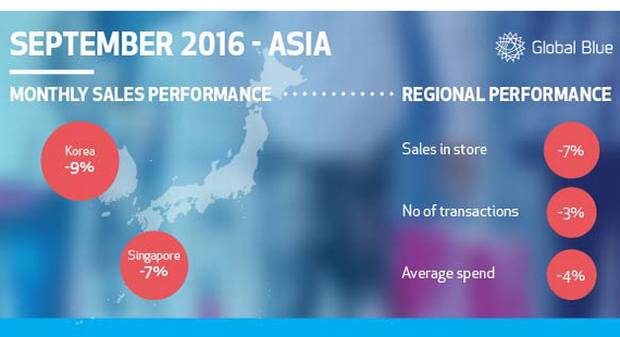
    Tax free shopping sales in Asia fell -7% year-on-year in September, compared to declines of -13% in August, according to Global Blue. The number of transactions dropped -3%, while average spend was also down -4% over the same period. Global Blue said Singapore, Japan and South Korea all saw declining tax free sales for the first time in three years.

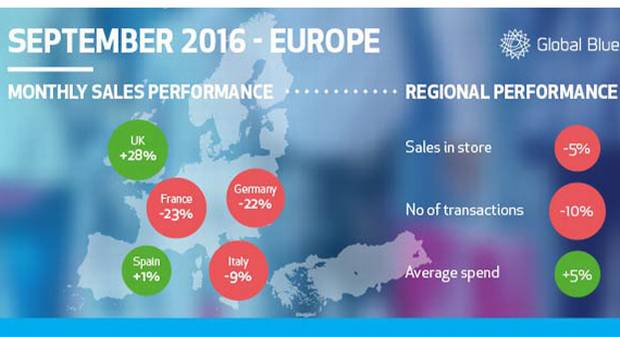
    In Europe, tax free shopping declined -5% year-on-year during September, compared to -3% in August.

    European transactions were down -10%, but average spend was up +5% year-on-year.
    asia_600x300

    Asian countries

    Global Blue said the increase in arrivals by middle-class Chinese travellers supported growth in tax free sales and the number of regional transactions, but was not enough to offset the decline in spend in Singapore, Japan and South Korea.

    Both Japan and South Korea saw a -9% dip in sales, while in Singapore sales fell -7%.

    The positive momentum seen earlier in the year has now gone, Global Blue said, reflected by the deep drop in average spend in Japan of -30% year, and the -13% fall in South Korea.

    In these two countries, the rise in arrivals was offset by the decline in average spend as a result of the strengthening currency in both countries. In September, the Japanese yen was +21% and the Korean won was +10% against the Chinese yuan, Global Blue noted.

    A shift in the Chinese traveller profile towards value seekers and experiential Free Independent Travellers is becoming the “new normal” across the region, the retail intelligence company said, which also had a negative impact on sales.

    Global Blue said it was witnessing a change in shopper profile in Japan’s department stores, as Millennials and Free Independent Travellers look beyond the country’s department stores and head to more niche or independent fashion and luxury retailers outside the Global Blue merchant network.

    With increasing numbers of less affluent Chinese arriving in Singapore from second- and third-tier cities, the country’s duty free retailers have been slow to offer a more diverse retail mix, Global Blue said.

    Chinese travellers are using Singapore as a departure point for cheaper shopping over the border in Malaysia.

    The number of travellers entering Singapore by land is rising (up +55% according to the latest Singapore Tourism Board figures reported in Jing Daily). Some of these tourists are on overland tours and therefore take in cheaper markets as well as Singapore’s high-end malls, unlike the higher-spending visitors who arrive by air.

    Singapore is also facing a challenge this quarter due to health concerns over the Zika virus outbreak, which is reducing visitor numbers, Global Blue noted.

    Chinese shopping across South Korea and Singapore saw tax free sales declines of -15% this month.

    While the tough comparison with 2015’s MERS-hit summer period has ended in South Korea, the Chinese are not returning in any great numbers due to the political tensions between the two countries, Global Blue noted.

    Hong Kongese tax free sales in South Korea and Singapore significantly declined in September (-77% and -98% respectively). While the local currency is strong, the legal context for the largely daigou traders is negatively impacting on sales, according to the company.

    Indonesians and Thais are now making up for the tax free spend at both destinations. In Singapore, Indonesian tax free sales are up +7% year-on-year, fuelled by positive currency exchange rates. In South Korea, Thais contributed to a massive sales spike of +87% year-on-year. Singaporean sales were also up +17% in September, a result of high net worth individuals who are regular shoppers in the region.
    eu-600x300

    European countries

    The tax free shopping decline in Europe is a slight improvement compared to the first half of the year, the company said, although countries hit by terrorism last year saw a reduction in sales.

    France and Germany continued to feel the effects of the downturn in visitors from Asia, with tax free sales down -23% and -22% respectively in September.

    The most serious decline in spending in France came from the Chinese, at -40%, while in Germany, Chinese spending was down -26%.

    Spain and southern European countries continued to outperform the continental Europe average of duty free sales, Global Blue said. Spain saw an increase in tax free sales of +1% compared to last September, while Greece increased total sales by +18%.

    The UK benefited from the fall in the pound and currently remains the best value luxury destination for duty free shoppers. The pound is now around -14% down on the euro since the Brexit vote, and almost -20% against the US dollar, Global Blue said.

    However, this situation is unlikely to last beyond next spring, the company noted, as most luxury goods are imported into the UK. From next season price increases on all imported goods will inevitably lead to higher prices in UK stores.

    The UK also benefited from the end of Ramadan and the annual back to school period for Chinese students, characterised by visiting families’ gift spending.

    The Chinese are the most valuable nation of shoppers for UK retailers, and they increased their spending by +25% during September.

    Saudi Arabia, Qatar, the UAE and Kuwait contributed to a +8% uplift in European sales in September.

    Cutbacks by the Saudi government, where well over half the population are state-employed, will put pressure on Saudi citizens’ outbound travel plans and spending in the medium term, Global Blue noted.

    Morocco posted a +28% rise in total sales in Q3 year-on-year, as shoppers avoided destinations that have suffered terrorist attacks. Cyprus saw a +11% uptick during the same period; Global Blue attributed this to an increase in Russian shoppers.


  • Aussie mobile customers’ private data up for sale

    Aussie mobile customers’ private data up for sale

    Private information on Australian mobile subscribers are being sold off by unscrupulous members of offshore call centers, according to an investigative report.

    The private details of customers from the market’s three operators – Optus, Telstra and Vodafone – are being offered for sale by a call center business named AI Solutions, run by Indian businesman Imran Khan.

    Information including home addresses, dates of birth, alternative numbers, billing statements and call history are being offered for between A$350 ($260) and A$1,000, the report states. Prices are higher for VIPs , politicians, police and celebrities.

    Security industry sources spoken to for the report say the practice of call center workers selling off Australian customer details has been long-standing, and potentially involves more than one company.

    In a press statement, a Vodafone Hutchison Australia spokesperson said the company is “aware there are individuals who do attempt to illegally access data through various channels from companies and organisations which hold customer information,” and has “invested millions of dollars over recent years in security systems and processes, and have a number of safeguards in place to prevent unlawful access of customer information.”

    For offshore call centers, security safeguards include paperless offices, a no mobile phone policy, no access to third party websites, email monitoring, role based systems access, continuous agent training and disciplinary process.

    An Optus spokesperson said the company has referred the matter to federal police, and Telstra said the company does everything it can to protect customer data.

  • Global 5G subscribers to reach 500m by 2022

    Global 5G subscribers to reach 500m by 2022

    Global 5G subscriptions will grow rapidly once the technology is available, Ericsson has forecast, with the vendor predicting that subscriptions will reach 500 million by 2022.

    North America is expected to lead the way in 5G uptake, with 5G projected to account for 25% of subscriptions in the region by 2022. But APAC will be the second fastest growing region, with 5G accounting for 10% of subscriptions.

    Ericsson’s latest Mobility Report also projects that global mobile subscriptions will grow to 8.9 million, with 90% of these for mobile broadband, and 6.1 billion unique subscribers in 2022.

    As of the third quarter of this year, there were 84 million new mobile subscriptions being added per quarter, for a total of 7.5 billion. India had the most net additions for the third quarter of 15 million, followed by China’s 14 million, Indonesia’s 6 million and Myanmar and the Philippines’ 4 million each.

    By the end of 2016 there will be 3.9 billion smartphone subscriptions worldwide, Ericsson said, with nearly 90% of these registered on WCDMA/HSPA and LE networks. This is expected to grow to 6.8 billion and 95% of subscriptions by 2022.

    The report also shows that mobile video is projected to grow by 50% annually through to 2022 to account for nearly 75% of all mobile data traffic. Increased use of live video streaming to contact friends, family and followers is meanwhile expected to contribute to a 39% annual growth in social media traffic.

    Finally, the report suggests that IoT will account for around 18 billion of the 29 billion connected devices forecast by 2022.

  • TV, video viewing shifts rapidly towards mobility

    TV, video viewing shifts rapidly towards mobility

    Average viewing times on mobile devices has grown by more than 200 hours a year since 2012, driving up overall TV and video viewing by an additional 1.5 hours a week, according to the latest Ericsson ConsumerLab TV & Media Report.

    The surge in mobile viewing is offset with a decline in fixed screen viewing of 2.5 hours a week, however the appetite for TV and video is not waning.

    Weekly share of time spent watching TV and video on mobile devices has grown by 85% (2010-2016). On fixed screens it has gone down by 14% over the same period.

    Also, 40% of consumers globally are “very interested” in a mobile data plan that includes unrestricted video streaming.

    In the US, 20% of mobile viewing is paid-for content using services such as Netflix, Hulu, and Amazon Prime.

    A major issue is low consumer satisfaction when trying to find something to watch, 44% of US consumers say they can’t find anything to watch on linear TV on a daily basis, an increase of 22% compared with last year (36%).

    In contrast, US consumers spend 45% more time choosing what to watch on VOD services than linear TV.

    Paradoxically, 63% of consumers claim that they are very satisfied with content discovery when it comes to their VOD service, while only 51% say the same for linear TV.

    The findings suggest that although the VOD discovery process is more time consuming than with linear broadcast TV, consumers rate it as less frustrating, as it implicitly promises the opportunity to find something they want to watch, when they want to watch it.

  • Mobile money halves overseas remittance costs

    Mobile money halves overseas remittance costs

    The average cost of sending international remittances with mobile money is less than half that of using global money transfer operators (MTOs), a new GSMA report reveals.

    Such lower prices contribute directly toward achieving targets within United Nations sustainable development goal (SDG) 102. Lower transaction fees also translate directly into additional income for remittance recipients.

    “Through mobile money services, the industry is directly supporting the goal of expanded financial inclusion for migrants and their families by reducing international remittance costs,” GSMA Chief Regulatory Officet John Giusti said. “The potential gains of achieving this target could be as high as $20 billion in additional income for remittance recipients.”

    The report noted that if people were able to send remittances from a mobile money account, the average cost of sending $200 was 2.7%, compared to 6% when using global MTOs.

    GSMA estimates that there are more than 400 million registered consumer accounts for mobile money across over 90 countries.

    “While today mobile money services are largely used for domestic transactions, international transfers represent the fastest-growing segment of mobile money services. In just a few years’ time, mobile money has moved from a purely domestic service to one that allows migrants to send remittances between more than 20 countries globally,” Giusti explained.

    World Bank data shows that more than 250 million people live outside their country of birth and regularly send money home, providing a financial lifeline to their families and contributing to the economies of their home countries.

    In 2015, global remittances totalled $581.6 billion, of which $431.6 billion, or nearly 75%, was sent to the developing world. However, the cost of international transfers remains high and directly impacts the income of remittance recipients.