Tag: #growth

  • Prada Group Posts 19th Consecutive Quarter Growth Amid Global Retail Challenges

    Prada Group Posts 19th Consecutive Quarter Growth Amid Global Retail Challenges

    The Prada Group has demonstrated sustained growth for the 19th straight quarter, even in the face of a complex global retail landscape. The financial results for the nine months leading up to September 30 reveal a promising overview.

    Financial Overview

    During this period, the luxury group’s net revenues climbed 9% year-on-year, reaching $4.7 billion. This growth was bolstered by a corresponding 9% rise in retail sales, which accounted for $4.2 billion. Despite a high base from the previous year, retail sales in the third quarter increased by 8%, mirroring the growth seen in the second quarter.

    Brand Performances

    Miu Miu, a brand under the Prada Group, has continued its strong performance. It reported a 41% growth over the nine months and a 29% increase in the third quarter. This comes after an impressive 105% surge during the same period the previous year.

    In contrast, sales for the Prada brand itself eased slightly. The third quarter saw a decrease of 1%, and a 2% drop was reported over the full nine months.

    Company Response

    Patrizio Bertelli, Chairman of Prada, viewed these results optimistically. He commented that the consistent performance, despite a challenging macroeconomic environment, “attests to the resilience of our brands and the effectiveness of our strategy.”

    Questions & Answers

    What was the overall growth for the Prada Group in the recent quarter?
    The Prada Group saw a 9% increase in net revenues year-on-year, reaching a total of $4.7 billion.

    How did the individual brands under the Prada Group perform?
    While Miu Miu saw significant growth with a 41% increase over nine months, the Prada brand experienced a slight decrease in sales, with a drop of 2% over the same period.

    What has the Chairman of Prada said about the company’s performance in this quarter?
    Chairman Patrizio Bertelli emphasized the consistent results despite a complex macroeconomic environment, attributing the success to the resilience of the brands and the effectiveness of their strategy.

  • Luk Fook Holdings Posts Double-digit Growth In Q2, Eyes Expansion In Mainland China

    Luk Fook Holdings Posts Double-digit Growth In Q2, Eyes Expansion In Mainland China

    In the second quarter ending September 30, Luk Fook Holdings, a prominent jewelry group, has revealed impressive double-digit growth in several critical indicators.

    Retail Sales Value on the Rise

    The group recorded an 18% year-on-year increase in Retail Sales Value (RSV) during the quarter. RSV, which encompasses self-operated shops, licensed outlets, and e-commerce ventures, saw a significant upturn.

    Retail revenue, made up of earnings from self-operated stores and e-commerce businesses, escalated by 15%. Concurrently, the group also experienced a 10% rise in same-store sales. The management attributed this robust growth, which surpassed the first quarter’s figures, partly to the low base during the same period the previous year.

    Regional Sales Growth

    In the Hong Kong, Macau, and overseas markets, the group noted a 13% increase in both RSV and retail revenues. Same-store sales grew by 13% in Hong Kong, 15% in Macau, and 13% in overseas markets.

    In Mainland China, the RSV surged by 20%, and retailing revenues swelled by 23%. The increment in same-store sales at company-operated locations was a modest 3%, while licensed shops saw a leap of 27%. Licensed stores constitute approximately 93% of the group’s total shop count in Mainland China.

    Performance by Category

    RSV’s growth varied across different categories. The value rose by 78% for gold and platinum products, increased by 16% for fixed-price gold items, and crept up by 3% for diamonds.

    As of September 30, the group had 3113 shops worldwide. There was a net reduction of 49 shops in the second quarter.

    Future Prospects

    The group maintains a cautiously optimistic outlook on its medium- and long-term business opportunities in Mainland China and plans to continue expanding in the market when the timing is right.

    Despite the ongoing US tariff policies affecting the global economy and the escalating China-US tensions, the Mainland government has implemented a “dual circulation” strategic layout to stimulate domestic demand, as observed by the retailer.

    Questions & Answers

    What was the percentage increase in Luk Fook Holdings’ Retail Sales Value (RSV) in Q2?
    It saw an 18% year-on-year increase in RSV during Q2.

    What contributed to the robust growth Luk Fook Holdings experienced in Q2?
    The growth can be attributed to the low base during the same period the previous year and the increase in both RSV and retail revenues in several markets.

    What is Luk Fook Holdings’ future plan for expansion in Mainland China?
    The group plans to continue expanding in the Mainland China market when the timing is appropriate, with a cautiously optimistic outlook on its medium- and long-term business opportunities.

  • Coca-cola Q3 Report: Revenue Boost Amid Challenging Market, Category & Regional Performance Explored

    Coca-cola Q3 Report: Revenue Boost Amid Challenging Market, Category & Regional Performance Explored

    In the third quarter, Coca-Cola revealed a 5% increase in net revenue, rising to $19.2 billion. Their organic revenue also observed a 6% increase during this period.

    Challenging Market Conditions

    James Quincey, the Chairman and CEO of Coca-Cola, acknowledged the challenging market conditions, yet credited the company’s impressive performance to their diverse beverage portfolio and the unique strengths of their franchise model.

    Growth Across Regions

    Unit case volume increased by 1% during the third quarter. This growth was driven by increasing sales in specific regions such as Central Asia, North Africa, Brazil and the UK.

    Category Performance

    The performance varied across the different beverage categories. Sparkling soft drink volumes remained stable, with a 1% growth in unit case volume. This growth was primarily driven by gains in Europe, the Middle East and Africa, and the Asia Pacific region.

    Coca-Cola Zero Sugar saw a considerable increase in sales, with a 14% rise across all regions. Diet Coke and Coca-Cola Light also performed well, with a 2% increase predominantly due to growth in North America and the Asia Pacific region.

    However, not all categories experienced growth. Sparkling flavours saw a 1% decline as gains in Europe, the Middle East and Africa were offset by weaker results in the Asia Pacific region. Additionally, juice, value-added dairy and plant-based beverages saw a 3% decline.

    Conversely, water saw a 3% increase across all regions, sports drinks rose 3% due to growth in North America, and coffee grew 2%, driven by the Asia Pacific and Europe, Middle East and Africa regions.

    Refranchising Strategy

    Coca-Cola also made advancements in its refranchising strategy during the quarter. Coca-Cola HBC AG agreed to obtain a controlling interest in Coca-Cola Beverages Africa, furthering the company’s shift towards a franchise-focused model. In a separate transaction, the company completed the sale of a 40% stake in Hindustan Coca-Cola to the Jubilant Bhartia Group.

    The company confirmed that its productivity programs have helped counter inflationary pressures and have supported investment in areas such as digital and omnichannel capabilities.

    Future Projections

    Coca-Cola anticipates generating a minimum of $15 billion in free cash flow for the remainder of the fiscal year and affirmed that it is on track to meet its full-year guidance. Looking further ahead, Quincey expressed confidence in the company’s ability to meet its 2025 guidance while also working towards achieving its long-term objectives.

    Questions & Answers

    Does Coca-Cola expect to meet its full-year guidance?

    Yes, Coca-Cola confirmed that it expects to meet its full-year guidance.

    Which regions contributed to the growth of Coca-Cola?

    The growth in the third quarter was largely driven by increasing sales in regions such as Central Asia, North Africa, Brazil and the UK.

    What was the result of Coca-Cola’s refranchising strategy in the third quarter?

    During the third quarter, Coca-Cola HBC AG agreed to obtain a controlling interest in Coca-Cola Beverages Africa, furthering the company’s shift towards a franchise-focused model. Additionally, the company completed the sale of a 40% stake in Hindustan Coca-Cola to the Jubilant Bhartia Group.

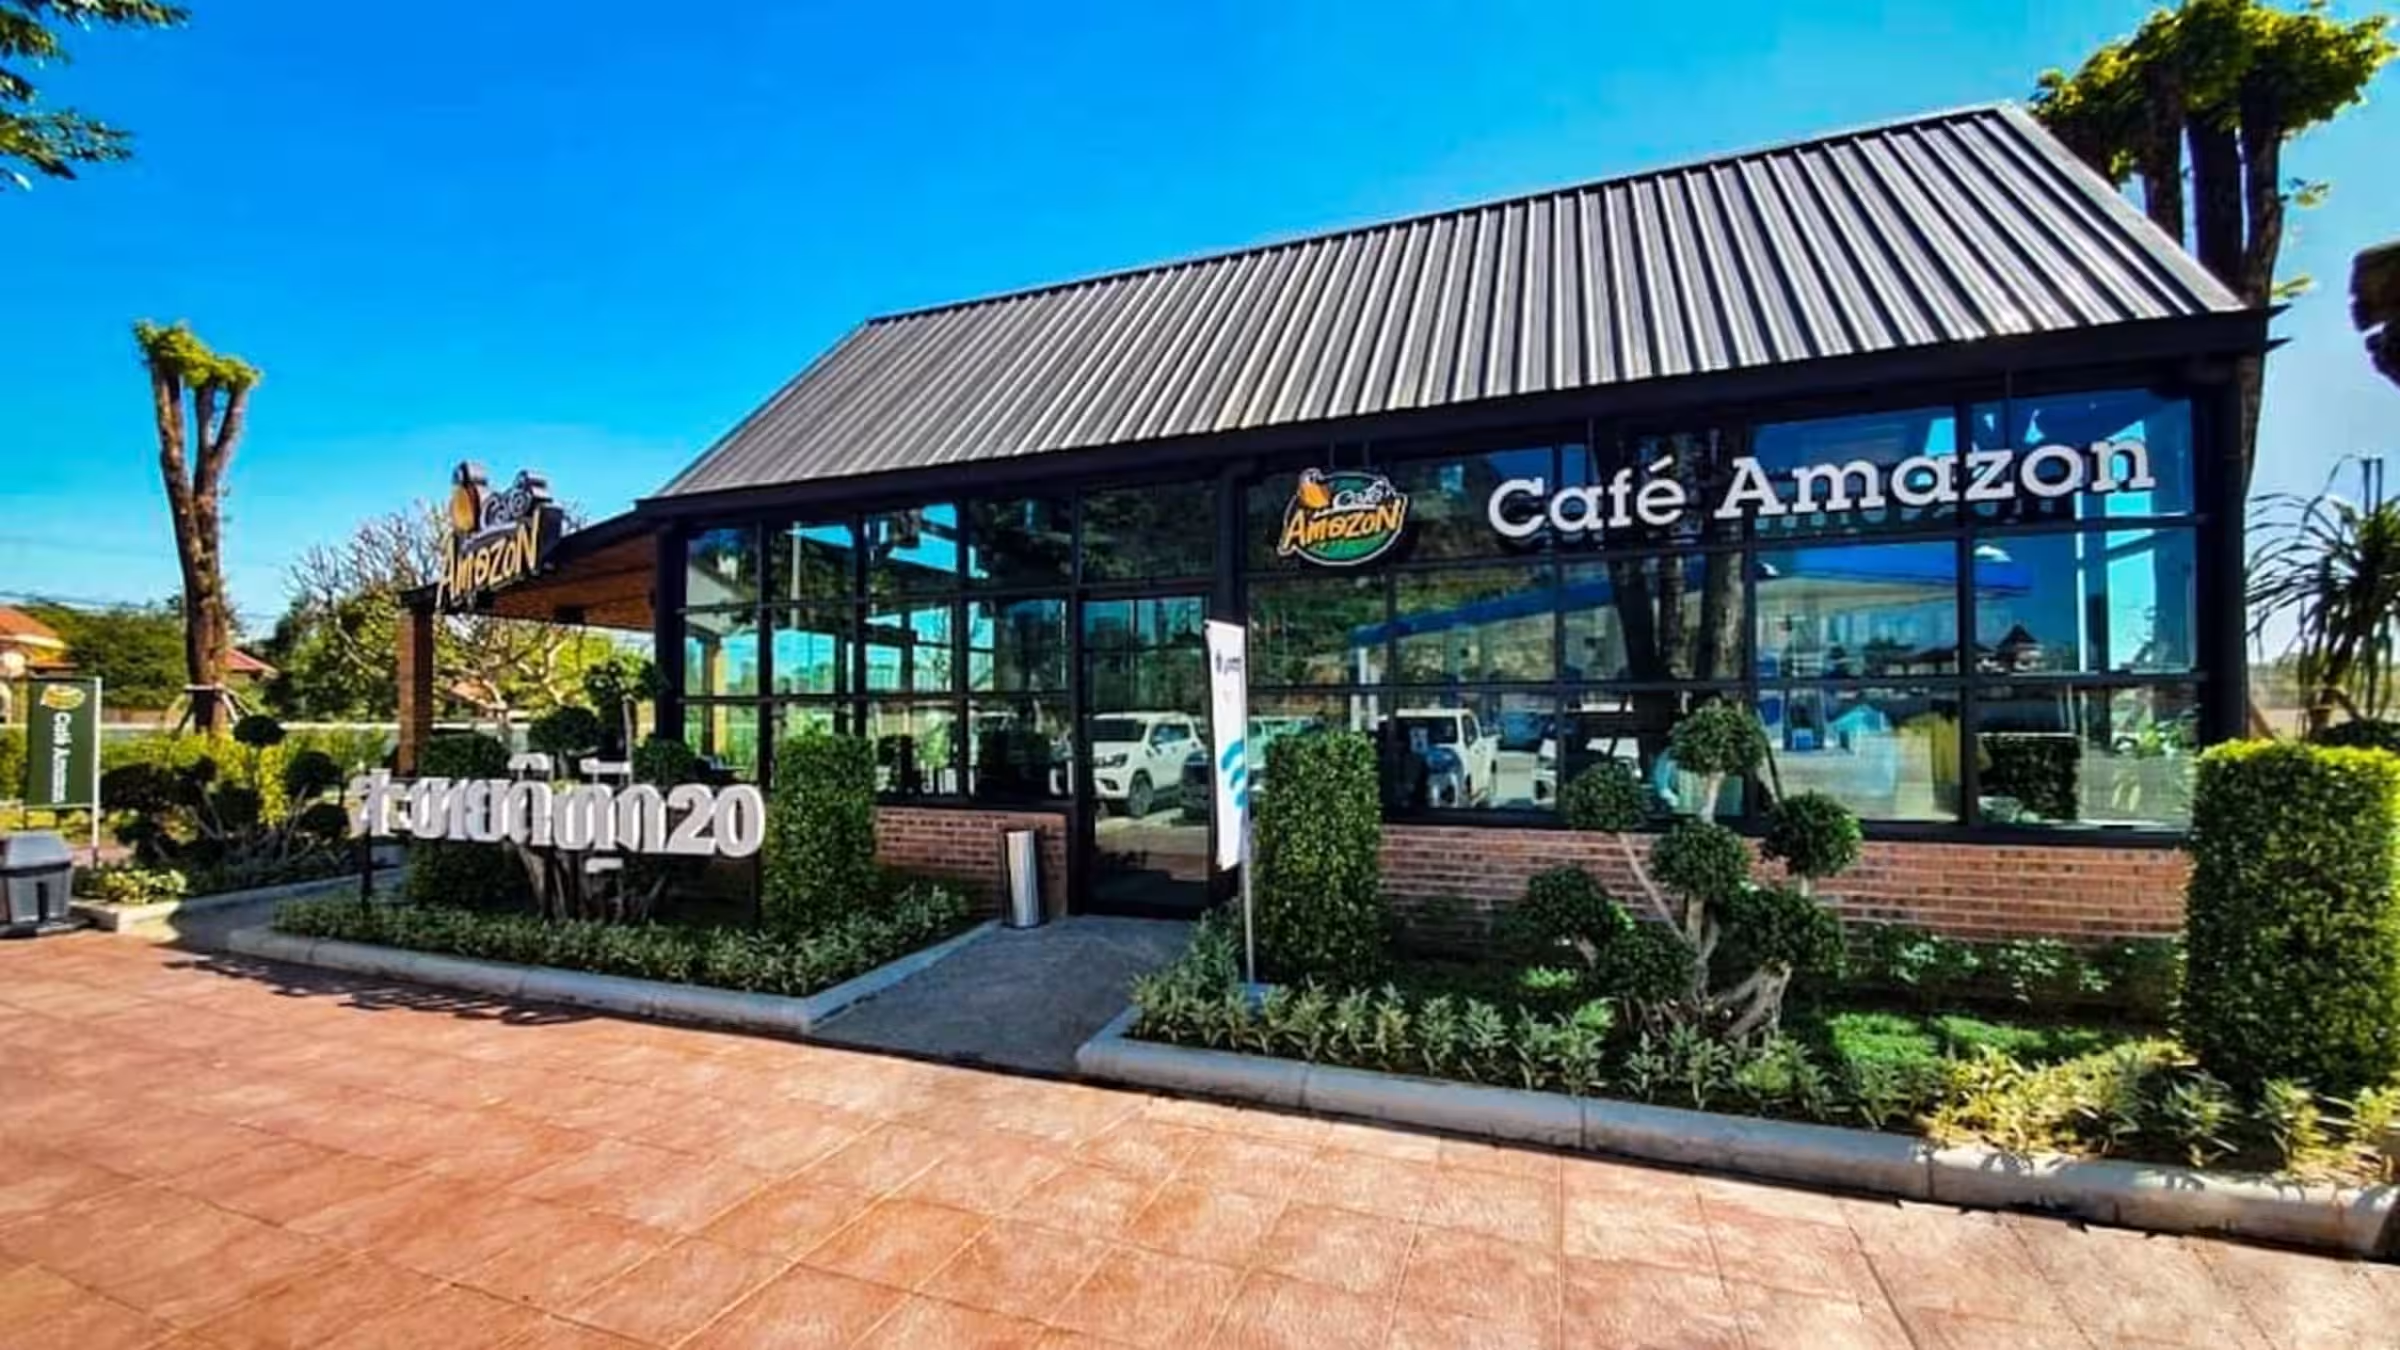
  • Cafe Amazon Accelerates Global Expansion, Sidesteps Vietnamese Market Amid Investor Exit

    Cafe Amazon Accelerates Global Expansion, Sidesteps Vietnamese Market Amid Investor Exit

    Cafe Amazon, a coffee chain operated by PTT Oil and Retail Business (OR), is accelerating its global expansion plans. Notably absent from its target locations, however, is Vietnam. This strategic decision follows the withdrawal of a Thai investor from Cafe Amazon’s joint venture in the Southeast Asian country.

    Global Expansion Focus

    As Cafe Amazon navigates its global growth strategy, it is centering its attention on several key markets. These include Laos, the Philippines, Japan, Oman, and Bahrain. The company is implementing a franchise model in these regions with a keen focus on ensuring consistent brand standards. This encompasses all aspects from design to quality and service.

    Growth Trajectory

    Cafe Amazon has seen rapid growth over the past ten years, expanding to over 5000 outlets worldwide. This impressive global presence has positioned the company as one of Asia’s largest coffee chains. Notably, in the second quarter of the fiscal year 2025, Cafe Amazon reported sales of over 107 million cups of coffee. This represents a nearly 5 per cent increase from the same time the previous year.

    Vietnamese Market Shift

    The exit of a key investor marks a significant change in Cafe Amazon’s approach to the Vietnamese market. In recent years, this market has seen increasing competition from both local and international coffee chains. While the specifics of the company’s restructuring have not been disclosed, Cafe Amazon has indicated that it intends to focus on markets with a higher potential for growth.

    Questions & Answers

    Why is Cafe Amazon not focusing on expansion in Vietnam?
    The company has decided to shift its focus following the exit of a Thai investor from its joint venture in Vietnam.

    Which markets is Cafe Amazon focusing on for its expansion?
    Cafe Amazon is turning its attention to Laos, the Philippines, Japan, Oman, and Bahrain for its global expansion.

    How is Cafe Amazon performing globally?
    Cafe Amazon has over 5,000 outlets worldwide, making it one of Asia’s largest coffee chains. In the second quarter of the fiscal year 2025, the company sold over 107 million cups of coffee, indicating a nearly 5 per cent increase from the previous year.

  • Adapting To Trade Changes: Fedex Bolsters Support For Asia Pacific Businesses Amid Market Shifts

    Adapting To Trade Changes: Fedex Bolsters Support For Asia Pacific Businesses Amid Market Shifts

    Federal Express Corporation, a world-leading express transportation company, is enhancing its support for businesses throughout the Asia Pacific. This move is in response to adapt to shifting market priorities, alterations in tariffs, and changes in customs regulations.

    In response to recent modifications to the U.S. de minimis exemption rules, FedEx arranged a series of webinars across nine markets in the Asia Pacific. These sessions attracted over 3,800 customers ranging from small- and medium-sized enterprises to multinational corporations. The webinars offered valuable insights on maintaining operational efficiencies, customs clearance, avoiding unexpected costs, and enhancing shipping automation. This has equipped businesses with the necessary tools and guidance to navigate the intricate trade environment of today.

    Trade Priorities and Market Shifts

    Feedback received after the webinars underlined two significant trends in cross-border trade priorities: Delivered Duty Paid disbursement fees and shipment duties and taxes.

    Whilst one-fourth of the APAC businesses surveyed still regard the United States as their primary market, over 40% are planning to redirect their attention to Intra-Asia (22%) and Europe (21%) over the coming year.

    Cost control and duty visibility are key concerns, with 25% of APAC businesses emphasising the need for clear pre-regulatory volatility. The difficulty of keeping pace with ever-changing rules has been cited by 27% of businesses as a significant barrier to trade.

    Salil Chari, Senior Vice President of Marketing and Customer Experience for the Asia Pacific at FedEx, stated, “We are working closely with our customers to ensure they maintain efficient access to vital markets. We are leveraging our deep regulatory expertise, innovative digital tools, and the strength of our global network to help Asia Pacific businesses improve cost and duty transparency, reduce clearance friction, and unlock new growth opportunities across the region and Europe with confidence.”

    Strengthening Cross-Border Business

    In response to businesses’ increasing demand for greater trade guidance and digital solutions to support supply chain diversification and cross-border trade expansion, FedEx plans to expand its comprehensive suite of offerings.

    FedEx is one of the leading entry-filers in the U.S. and provides 24/7 support to ensure smooth shipment movement across more than 220 countries and territories. For U.S.-bound trade requiring particular attention, FedEx’s U.S. Tariff Hub offers updated guidance on tariffs, required documentation and customs policies.

    Furthermore, 27% of APAC businesses are seeking automated tools to expedite customs clearance. To this end, FedEx continues to invest in digital trade solutions, such as the industry-leading AI-enabled Harmonized Tariff Schedule code-lookup feature and a Customs AI chatbot.

    FedEx is also working to strengthen connectivity across critical intra-Asia and Asia-Europe trade corridors to support Asia Pacific businesses looking to diversify beyond the U.S.

    Questions & Answers

    What initiatives has FedEx introduced to support businesses in the Asia Pacific?
    FedEx has arranged a series of webinars providing insights on maintaining operational efficiencies, customs clearance, and cost management. They are also expanding their suite of offerings to include automated tools for customs clearance and strengthening connectivity across critical trade corridors.

    What are the top concerns of APAC businesses according to the feedback received by FedEx?
    The top concerns are cost control, duty visibility, and the difficulty of keeping pace with changing trade regulations.

    What digital solutions has FedEx introduced to support customs clearance?
    FedEx has introduced an AI-enabled Harmonized Tariff Schedule code-lookup feature and a Customs AI chatbot to help expedite the customs clearance process.

  • Pharma Leaders At Flypharma Highlight Air Cargo’s Role In Global Health

    Pharma Leaders At Flypharma Highlight Air Cargo’s Role In Global Health

    At the FlyPharma Amsterdam 2025 conference, leaders from the worldwide pharmaceutical industry gathered to highlight the importance of collaboration for the steady global transportation of essential healthcare items and life-saving medicines. The conference took place amidst the backdrop of rapidly changing regulations, shifting trade flows, and an uncertain geopolitical landscape.

    Growth in Pharma Sector Increases Demand for Specialised Air Cargo

    The global healthcare and pharmaceutical industry is projected to achieve a total worth of USD 1.77 trillion by 2025. This growth is primarily attributed to advances in biologics, digital health, and personalized medicine, along with increased patient access on a global scale.

    The industry’s momentum is directly reflected in increased demand for airfreight capacity, especially for temperature-sensitive, high-value shipments. The pharma airfreight segment alone is predicted to witness over 6 percent annual growth, as manufacturers and logistics providers prioritize speed, dependability, and adherence to Good Distribution Practice (GDP) standards.

    Air cargo carriers and airports are making significant investments in IoT tracking, cold-chain infrastructure, and digital visibility tools to cater to this growing vertical. The fastest growth is anticipated in corridors linking Asia, Europe, and North America. The pharma and healthcare logistics sector is emerging as a strong and premium segment within the global air cargo market.

    Schiphol: A Global Centre for Pharma Logistics

    Amsterdam Airport Schiphol is a crucial global hub for pharmaceutical logistics. With its central European location, advanced infrastructure, and robust network of logistics partners, the airport is essential for global pharmaceutical supply chains. Schiphol contributes significantly to the worldwide distribution of vaccines and medicines and enhances the Dutch economy, further establishing the Netherlands as a hub for international trade and innovation in life sciences.

    The pharmaceutical logistics ecosystem at Schiphol has considerable implications not only for global public health but also for the Dutch economy. In 2024, the Netherlands exported pharmaceutical products worth USD 38.49 billion, highlighting the sector’s role in driving trade, innovation, and high-value employment. Schiphol’s success as a pharma logistics hub encourages companies to invest, expand, and drive innovation in the Netherlands, making the country more competitive and appealing to life sciences entities.

    Schiphol’s importance as a global logistics hub was further underscored during the COVID-19 pandemic, during which it served as one of Europe’s primary gateways for vaccine transportation and temperature-sensitive pharmaceuticals.

    The Role of Air France KLM Martinair Cargo in Pharma Logistics

    Air France-KLM Martinair Cargo (AFKLMP Cargo) has positioned itself as a leading player and innovator in pharmaceutical logistics, being among the first airlines to receive IATA CEIV Pharma certification. The airline’s dual-hub structure in Amsterdam Schiphol and Paris Charles de Gaulle, situated in Europe’s “pharma belt,” provides unique resilience and adaptability in a fluctuating market.

    According to GertJan Roelands, SVP Commercial, AFKLMP Cargo, the company’s growth in the pharmaceutical and healthcare segment has been a strategic priority over the past five years. The airline has made considerable investments in infrastructure and introduced new digital solutions while optimizing processes to enhance resilience and transport quality. The airline’s commitment to this strategy is reflected in its record-breaking performance in the pharmaceutical and healthcare segment and its increasing market share.

    Innovation, Sustainability, and Excellence in Cool Chain

    AFKLMP Cargo continues to expand cool-room capacity, develop digital monitoring dashboards for operational visibility, and pioneer sustainable temperature-control solutions such as CO₂-based refrigerant technology at Paris CDG. As personalized medicine and advanced therapies gain traction, the airline collaborates closely with shippers, forwarders, and life science clusters, providing time-critical solutions that are fully compliant with GDP and CEIV.

    Despite market volatility and geopolitical pressures, AFKLMP Cargo remains steadfast in its focus on on-time delivery and maintaining the integrity of the cool chain supply. The resilience demonstrated during the pandemic continues to shape the airline’s long-term strategy.

    In the words of GertJan Roelands, “Pharmaceutical logistics is not just about transportation — it’s about trust, responsibility, and resilience. Our mission is to deliver healthcare products safely and reliably, adapting to new challenges while ensuring patients around the world receive the medicines they need.”

    Questions & Answers

    What are the main factors driving the growth of the global pharmaceutical industry?
    The main factors driving this growth include advances in biologics, digital health, and personalized medicine, along with increased patient access globally.

    What is the projected growth for the pharma airfreight segment?
    The pharma airfreight segment is predicted to grow more than 6 percent annually.

    What role has Schiphol played in global pharmaceutical logistics?
    Schiphol serves as a crucial global hub for pharmaceutical logistics, contributing significantly to the worldwide distribution of vaccines and medicines, and enhancing the Dutch economy.

  • Liege Airport records a strong growth of +23% in the third quarter of 2025

    Liege Airport records a strong growth of +23% in the third quarter of 2025

    Liege Airport (LGG) has been experiencing an upward trajectory in terms of both aircraft movements and cargo volumes during the third quarter. A robust 23% growth in tonnage was recorded for the months of July, August, and September in 2025 as compared to the same quarter in 2024, while aircraft movements increased by 9%.

    Unwavering Performance

    Liege Airport’s performance remains commendable not only in the short term but also over the past two years. The airport’s CEO, Laurent Jossart, shed light on the recent success, stating that the air cargo community processed a significant 334,956 tons of freight in Q3 2025. This figure represents an impressive 23% growth from the previous year’s Q3 tonnage of 272,210. In addition, a year-to-date growth of 14.4% was reported.

    The notable growth of the last quarter was primarily driven by a healthy uptick in e-commerce imports, as well as the robust European exports flown via Liege Airport, which saw a quarterly growth of 26% compared to the previous year. This substantial growth underscores the increasing significance of Liege Airport to the European export industry.

    Concerning aircraft movements, a total of 7,262 cargo flights were operated – a 9% rise from Q3 2024, which recorded 6,691 cargo flights.

    Europe’s Prominent Full Freighter Airport

    Further highlighting LGG’s success is its consolidation as the leading full freighter airport in Europe, a milestone reached in 2025. In the first nine months of the year, Liege Airport became the leading hub for three verticals – flowers, e-commerce, and horses. Jossart added that a total of 961,640 tons of air cargo passed through their facilities.

    Looking at a longer timeframe, from 2019 to 2024, a recent global air traffic survey positioned Liege Airport among the top 5 cargo airports worldwide in terms of freight growth, having experienced a 29% increase.

    Laurent Jossart concluded by stating that this performance solidifies Liege Airport’s strategy of being a sustainable, efficient, and multimodal European logistics hub.

    Questions & Answers

    What has been the growth rate of Liege Airport in Q3 2025 as compared to Q3 2024?
    The airport recorded a 23% increase in tonnage and a 9% rise in aircraft movements in Q3 2025 compared to the same period in 2024.

    What factors contributed to the significant growth of Liege Airport in the last quarter?
    The growth was primarily driven by the healthy flow of e-commerce imports and the robustness of the European exports flown via the airport.

    What leadership position did LGG consolidate in 2025?
    LGG consolidated its position as Europe’s leading “full freighter” airport in 2025, handling a total of 961,640 tons of air cargo in the first nine months of that year.

  • Levi Strauss & Co. Sees Robust Q3 Growth Driven By Direct-to-consumer Sales Surge

    Levi Strauss & Co. Sees Robust Q3 Growth Driven By Direct-to-consumer Sales Surge

    Levi Strauss & Co. continues to prove its strength in the retail industry, experiencing significant profit in the third quarter. The primary factor driving this growth is the double-digit increase in sales through the company’s direct-to-consumer (DTC) channel.

    Financial Performance

    By the end of the third quarter on August 31, the firm’s net revenues had reached $1.5 billion, showing a 7% rise year-on-year. This growth is consistent in both reported and organic terms. Sales in the Americas, Asia, and Europe also saw considerable increases, with 6%, 12%, and 5% respectively. Specifically, the U.S. saw a 3% increase in sales, reflecting the company’s strong presence in the domestic market.

    The DTC channel played a significant role in this surge with net revenues increasing by 11% as per reported data and 9% organically. This is attributed to a 7% jump in the U.S., a 4% rise in Europe, and a staggering 14% surge in Asia. Meanwhile, wholesale net revenues also observed an uptick, though at a slower pace, with a 3% rise in reported terms and a 5% increase organically.

    Profit and Future Strategy

    The company’s operating margin saw remarkable growth, reaching 10.8% from the previous year’s 2.3%. The gross margin also improved by 110 basis points to a robust 61.7%. The driving factors for this improvement were a favorable channel mix and price increases, which were slightly offset by the effects of import tariffs.

    The net income from continued operations, excluding the Dockers business, stood at $122 million, a significant increase from last year’s $23 million. The company also successfully sold the Dockers intellectual property and operations in the U.S. and Canada for $194.7 million as of July 31. The remaining operations are projected to be sold in the first quarter of the upcoming year.

    The President and CEO of Levi Strauss & Co., Michelle Gass, lauded the company’s impressive performance, attributing it to the strategic shift towards becoming a DTC-first, comprehensive denim lifestyle retailer. Despite the complex macroeconomic environment, Gass expresses optimism about the company’s ability to sustain this profitable growth well into 2026 and beyond.

    Expectations for the Coming Year

    Levi Strauss & Co. has revised its full-year guidance upward, predicting a 3% increase in net revenues. This is a significant rise from the 1-2% growth forecast provided in the second quarter. This prediction assumes that import tariffs from China will remain at 30% and the rest of the world at 20%.

    Questions & Answers

    What was the primary driver behind Levi Strauss & Co’s growth in the third quarter?
    The key driver was the double-digit growth in sales from the company’s direct-to-consumer (DTC) channel.

    What led to the improved operating margin of Levi Strauss & Co.?
    The improvement in operating margin was driven by a favorable channel mix and price increases, partially offset by the impact of tariffs.

    What are Levi Strauss & Co.’s growth expectations for the upcoming year?
    For the coming year, the company predicts a 3% increase in net revenues, assuming that import tariffs remain the same.

  • Vietnam Leads In Projected Salary Growth In Southeast Asia, Says Global Study

    Vietnam Leads In Projected Salary Growth In Southeast Asia, Says Global Study

    Vietnam is projected to have the most significant salary increase among Southeast Asian countries in 2025, with an estimated growth rate of 7.7%, according to a recent study by a leading global professional services firm.

    Salary Increase and Turnover Study for Southeast Asia

    The study, which ran from July to September 2025, assessed salary alterations and staff turnover rates from over 700 businesses in Indonesia, Malaysia, the Philippines, Singapore, Thailand, and Vietnam. The research indicated that the anticipated salary hikes for Southeast Asia (SEA) are projected to be 5.3% for 2026.

    When examining salaries across various industries per country, the life sciences and medical devices sector is predicted to witness the highest increase in Singapore (4.6%), whereas technology is leading in Vietnam (7.1%) and Indonesia (5.9%). In Malaysia, the consulting, business, and community services sector takes the lead with an expected increase of 4.8%.

    Retaining Top Talent and Reducing Attrition

    Rahul Chawla, the partner and head of Talent Solutions for Southeast Asia at the professional services firm, highlighted the dual challenges organizations are currently grappling with. As companies across SEA ramp up their investments in technology and strategic ventures, they are increasingly concentrating on retaining their best and most skilled employees. According to Chawla, balancing escalating compensation costs with the necessity for agility is paramount. The most successful enterprises are utilizing real-time market data and total rewards strategies to stay competitive.

    The study found that employee attrition rates were in double digits across all countries in the region. The Philippines and Singapore are anticipated to have the highest turnover rates, at 20.0% and 19.3% respectively, followed by Malaysia at 18.2%.

    Attrition rates also differ across industries, with the consulting, business, and community services sector topping the list with a rate of 22.6%. This is followed by the retail sector at 21.6% and manufacturing at 17.5%. The research revealed that 42% of businesses report difficulties in hiring or keeping employees.

    Skills Gap Challenges

    The study also found that 63% of businesses are currently dealing with skills gap challenges, while 12% anticipate short-term gaps, and 16% foresee longer-term gaps. Roles in information technology, engineering, and sales remain the most difficult to fill, while new hire premiums range between 1.3 to 8.2%, which is lower than the previous year, indicating an increased focus on cost control.

    The most sought-after “hot jobs” include sales (24%), information technology (24%), artificial intelligence (AI)/machine learning (ML) (21%), cybersecurity (20%), and engineering (19%). This trend towards digital and risk-focused skills suggests that firms are emphasizing sustained compensation strategies to secure skills that are crucial for the future in an increasingly competitive market.

    Evon Lock, head of data solutions for Southeast Asia at the professional services firm, commented that despite the hiring and retention pressures, most organizations remain cautiously optimistic and plan to maintain or slightly increase their workforce.

    Questions & Answers

    What is the expected salary increase in Vietnam in 2025?
    The expected salary increase in Vietnam in 2025 is 7.7%.

    Which industry is projected to have the highest salary increase in Singapore?
    The life sciences and medical devices industry is expected to have the highest salary increase in Singapore.

    What are the most in-demand jobs according to the study?
    The most in-demand jobs are in sales, information technology, artificial intelligence/machine learning, cybersecurity, and engineering.

  • Singapore’s Retail Sector Sees Robust Growth In July, Led By Tech Industry

    Singapore’s Retail Sector Sees Robust Growth In July, Led By Tech Industry

    In July, the retail sector in Singapore displayed promising growth, with most categories reporting an uptick in sales.

    July’s Retail Sales Growth

    Singapore’s retail industry experienced an impressive 4.1% increase in July, a significant improvement over June’s modest 0.5% rise, when motor vehicle sales are excluded from the total. The total estimated retail sales value for the month was SG$3.6 billion (US$2.8 billion), with online sales accounting for 15.5% of this figure.

    On a seasonally adjusted basis, July’s retail sales figures represented a 3.8% increase from the previous month.

    Industries Contributing to Retail Growth

    The majority of industries within the retail trade sector contributed to July’s growth. The most substantial improvement was observed in the computer and telecommunications equipment industry, which reported a year-on-year increase in sales of 11.1%.

    Sales in the watches and jewellery sector, as well as supermarkets and hypermarkets, rose by 9.6%. Department stores, cosmetics, recreational goods, along with optical goods and books, also experienced sales uplifts, ranging between 4.1% and 8.6%.

    However, not all industries enjoyed a rise in sales. Food and alcohol, apparel and footwear, and petrol service stations saw declines in sales of between 2% and 5.6%.

    Growth in Food and Beverage Services

    The food and beverage services sector also registered growth in July. This sector saw a rise of 1.7% in sales, an improvement over the flat growth reported in June. The total sales value of F&B services was approximately SG$1 billion, with online sales representing 25.9% of this figure.

    Questions & Answers

    Which retail sector experienced the most substantial growth in July?
    The computer and telecommunications equipment industry reported the most significant growth, with sales up 11.1% year-on-year.

    Did all retail sectors in Singapore experience growth in July?
    No, the food and alcohol, apparel and footwear, and petrol service stations sectors saw a decline in sales.

    How did the food and beverage services sector perform in July?
    The food and beverage services sector saw a 1.7% rise in sales, compared to flat growth in June. Online sales made up 25.9% of the total sales in this sector.

  • Tim Hortons China Sees Q2 Recovery, Cites New Strategy And Franchise Growth As Key Drivers

    Tim Hortons China Sees Q2 Recovery, Cites New Strategy And Franchise Growth As Key Drivers

    TH International Limited, the company responsible for operating Tim Hortons coffee shops in China, has reported a slight recovery in the second quarter. This recovery has helped to counterbalance the economic strain resulting from store closures and decreased revenue from company-operated outlets.

    Financial Performance

    The system sales experienced a 1.4 percent increase since last year, reaching a total of $57.2 million. Despite this growth, total revenues decreased by 4.9 percent, amounting to $48.7 million. However, the company recorded a positive adjusted EBITDA of $300,000 and a reduced adjusted net loss of 16.2 percent, which amounts to $5.5 million.

    The company’s CEO, Yongchen Lu, stated the company’s “Coffee + Freshly Prepared Food” strategy as the driving force behind the improved results. New product offerings led to an increase in food revenue by 8.6 percent from last year. Consequently, the contribution of food revenue to system sales rose to a record 35.2 percent.

    Albert Li, the CFO, pointed out the efficiency enhancements in the company’s operations. The costs of food, packaging, and labor dropped as a percentage of store revenues. He attributed the improved financial performance to the refinement of store unit economics and operational efficiencies at both store and corporate levels.

    Growth and Challenges

    During the quarter, the company introduced 40 made-to-order stores while discontinuing 49 non-made-to-order outlets, mainly smaller Tim Hortons Express units. Despite this, the contribution from company-operated stores dropped to $3.8 million, a decrease from the previous year. This decrease can be attributed to store consolidation and declining same-store sales.

    Franchising proved to be a successful venture. Revenues from franchised stores increased by 50.7 percent, reaching $9.4 million. The franchise network expanded from 333 to 449 locations. In addition, other revenues, including sub-franchise and retail businesses, more than doubled compared to last year.

    Despite a net loss of $10.6 million, the management remains optimistic. They believe the operational enhancements and an improved food mix put the company in a position for steady growth.

    Questions & Answers

    What was the company’s strategy that drove its stronger results?
    The company employed a “Coffee + Freshly Prepared Food” strategy that particularly improved results through new product offerings.

    How did the company improve its financial performance?
    The company refined store unit economics and enhanced operational efficiencies at both the store and corporate levels.

    What changes occurred in the company’s franchising operations?
    There was a revenue increase of 50.7 percent from franchised stores. The franchise network also expanded to 449 locations from 333 in the previous year.

  • Nike’s Strategic Pivot To Outdoor Recreation: Revitalizing Acg Amid Rising Competition

    Nike’s Strategic Pivot To Outdoor Recreation: Revitalizing Acg Amid Rising Competition

    Nike, the sportswear behemoth, is making a strategic move into the expanding outdoor recreation industry. Starting with the launch of a new trail running shoe, Nike aims to invigorate its lesser-known sub-brand, ACG, and turn it into a vital source of growth.

    Nike’s Outdoor Recreation Strategy

    Beginning with the Ultra-Trail du Mont-Blanc event, an ultramarathon in France, Nike plans to release its Ultrafly trail running shoe, which is a part of the ACG (All Conditions Gear) outdoor sub-brand. This move is an attempt by Nike to reestablish ACG as a credible contender in the realm of performance-focused trail running shoes.

    Commenting on the broader strategy, Nike’s CEO, Elliot Hill, explained that the company is refocusing on core sports such as running in response to the growing competition from smaller brands. Nike is striving to catch up in the outdoor recreation industry, which has seen substantial growth during the pandemic, and in China, where outdoor activities have gained considerable popularity. The company’s struggle in these two markets has been a factor in its diminished share of the global sportswear industry.

    ACG Ultrafly and Future Plans

    Nike-sponsored athletes, including Anthony Costales, will wear the ACG Ultrafly during races. The shoe is scheduled to be available to consumers in spring 2026. In addition, a rejuvenated version of the Zegama trail runner, also under the ACG brand, will be released later in 2026.

    However, revitalizing the ACG brand, initially launched in 1989 with an emphasis on hiking and biking, will not be without its challenges. The brand is currently associated with “gorpcore”, a fashion trend that blends functional gear with style. Despite these challenges, Nike is looking towards the long-term benefits of this strategy, especially in the Chinese market.

    The Chinese Market

    Nike established its ACG team as a sub-brand in October and appointed Angela Dong, VP for all of Greater China, to lead the unit. Sales of outdoor apparel in China nearly doubled between 2019 and 2025, and outdoor footwear sales increased by 65% in the same period. Despite this, Nike has reported double-digit sales declines in China over the past three quarters.

    The Chinese market has posed significant challenges for Nike as it faces stiff competition from other retailers. Economic instability and high youth unemployment have also impacted spending.

    Nike’s global sportswear market share fell to 26% from 29% in 2021. Other brands such as Hoka have used trail running to bolster growth, underscoring the potential that Nike sees in this segment.

    Launching at a Hoka-sponsored event could be viewed as Nike’s attempt to overshadow its rival, demonstrating Nike’s ability to leverage its financial strength against smaller brands.

    Questions & Answers

    What is Nike’s new strategy in the sportswear market?
    Nike is focusing on outdoor recreation, reviving its ACG sub-brand with the launch of a trail running shoe.

    What challenges does Nike face in revitalizing the ACG brand?
    ACG, launched with a focus on hiking and biking, has become associated with the “gorpcore” fashion trend, which may make it difficult for the brand to reposition itself as a serious contender in the outdoor recreation space.

    What is the current state of Nike in the Chinese market?
    Despite the growth in outdoor apparel and footwear sales in China, Nike has experienced double-digit sales declines in this market over the past three quarters due to tough competition and economic factors.

  • Treasury Wine Estates Records Robust Financial Growth; Penfolds Brand Sales Surge 7.3%

    Treasury Wine Estates Records Robust Financial Growth; Penfolds Brand Sales Surge 7.3%

    Treasury Wine Estates (TWE) has seen a substantial growth pattern in its financial performance for the present fiscal year. The company’s net group sales have experienced a 7.2% increase, elevating the figure from $2.7 billion to $2.9 billion.

    Growth in Profit and Profit Margin

    The gross profit of the group has witnessed a 15% surge, amounting to $1.4 billion. This growth is mirrored in the company’s gross profit margin, which has moved up from 45.3% to 48.6% year-on-year.

    The firm’s Earnings Before Interest and Taxes (EBITS) has also seen a significant growth, marking a 17% increase to reach $770 million. The company’s net profit after tax followed suit, with an 8.1% increase, amounting to $450.7 million.

    Brand Performance

    The company’s renowned brand, Penfolds, has also reported a positive net sales revenue growth of 7.3%, reaching $1 billion. The brand’s EBITS has also risen, showing a 13.2% increase to reach $477 million.

    The Treasury Americas brand of the group has reported a notable 16.8% surge in its net sales revenue, bringing the total to $1.2 billion. This growth was accompanied by a 33.9% increase in its EBITS, reaching $308.6 million.

    However, TWE’s Treasury Premium Brands reported a decrease in its net sales revenue by 5.9% year-on-year, with the figure standing at $693.5 million. The brand’s EBITS also plummeted, reflecting a 27.6% drop to $55.1 million.

    CEO Statement

    Tim Ford, CEO of Treasury Wine Estates, expressed his satisfaction with the company’s fiscal performance. Despite facing challenges in several markets, the company remained committed to executing its business strategies, strengthening the company’s long-term growth.

    Ford attributed the company’s strong financial performance to Penfolds’ continued momentum and the successful integration of Daou Vineyards into their luxury portfolio. He also highlighted the company’s recent transition to a new luxury portfolio-led operating model that enhances strategic clarity and positions the firm well for the future.

    Questions & Answers

    What is the reported increase in Treasury Wine Estates’ group net sales?
    The group net sales have seen a 7.2% increase, moving from $2.7 billion to $2.9 billion for the current fiscal year.

    What has been the performance of Penfolds and Treasury Americas brands in terms of net sales revenue?
    Penfolds reported a 7.3% increase in net sales revenue to $1 billion, while Treasury Americas revealed a 16.8% rise, amounting to $1.2 billion.

    What measures has the company undertaken for long-term growth as per the CEO’s statement?
    The CEO revealed that the company has remained focused on executing its business plans, integrating Daou Vineyards into their luxury portfolio, and transitioning to a luxury portfolio-led operating model.

  • Australian Food Industry Shows Resilience With Robust Growth Amid Global Challenges

    Australian Food Industry Shows Resilience With Robust Growth Amid Global Challenges

    The food and grocery manufacturing industry in Australia has demonstrated robust growth, further solidifying its significance as the country’s biggest manufacturing sector and a crucial provider of regional employment opportunities.

    The Australian Food and Grocery Council’s (AFGC) State of the Industry 2023-24 report reveals that the sector’s turnover has experienced a 5.3 per cent growth, equating to a total of $173 billion.

    Employment and Exports

    Employment in the industry has also seen an increase of 4.4 per cent, resulting in almost 300,000 people now being employed in the sector, with over a third of these individuals located in regional Australia.

    Exports within the industry recorded a 5.2 per cent growth, while imports declined by 3.3 per cent. Interestingly, the US has surpassed China as the leading export market for Australia.

    Colm Maguire, CEO of AFGC, expressed his optimism for the sector’s future, emphasizing its “enormous potential”. He highlighted the need for policy and strategic backing as key for continued growth.

    Maguire added, “With the proper policy framework and strategic support, the food and grocery manufacturing sector can further enhance Australia’s economy – fostering regional employment, reinforcing Australia’s standing as a strong manufacturing nation, and securing our food and grocery supply amidst an increasingly complicated global landscape.”

    Challenges and Future Perspectives

    Despite the encouraging figures, the report also drew attention to certain challenges faced by the sector. These include an 11 per cent decline in capital investment, which currently stands at $3.8 billion, and ongoing cost pressures.

    As the Albanese Government progresses with its “Future Made in Australia” agenda, the AFGC argues that the food and grocery manufacturing industry is in a strong position to take the lead. This is reflected in their proposed seven productivity pillars, which concentrate on reducing bureaucracy, building resilient supply chains, and ensuring access to affordable, reliable energy.

    Questions & Answers

    What growth has the Australian food and grocery manufacturing industry seen recently?
    The industry has seen a 5.3 per cent increase in turnover, equating to $173 billion. Employment in the sector has risen by 4.4 per cent, with nearly 300,000 people now employed.

    Who is now Australia’s top export market?
    The US has now overtaken China as Australia’s top export market.

    What challenges does the Australian food and grocery manufacturing industry face?
    The industry faces challenges such as an 11 per cent decrease in capital investment and ongoing cost pressures.

  • Yili Group Forecasts Robust Revenue Growth; Investments Boost Dairy Production Capacity

    Yili Group Forecasts Robust Revenue Growth; Investments Boost Dairy Production Capacity

    Yili Group, a leading dairy company based in New Zealand, is predicting a steady increase in revenue for the upcoming year, following impressive growth during the first half of the current year. The company’s subsidiaries, Westland Milk Products and Oceania Dairy, reported a joint unaudited revenue growth of 16% during the first half of this year, compared to the same timeframe in the previous year. In addition, the pre-tax profit experienced a 12% increase.

    Investing in Production Capacity

    Zhiqiang Li, the Executive Director of Yili Group, stated that the companies are in an excellent position for sustained growth due to significant investments in their production capacity at essential sites.

    “Major investments have been made to increase the production capacity of high-demand, high-value products at Westland’s Hokitika and Rolleston sites, as well as ODL’s Glenavy facility. This is in response to the rising global demand for top-quality dairy products,” said Li.

    Among the significant upgrades is an increase in butter production by 10,000 tonnes at the Hokitika site, as well as enlarged skim milk powder output at the Glenavy site.

    Boosting UHT Cream Production and Export

    These enhancements have facilitated a 20% growth in UHT cream production at the Rolleston site. A considerable amount of this production is exported to China, facilitated by the addition of new equipment such as a silo and revamped unloading facilities.

    In the past year, Westland and Oceania have partnered in sales and marketing ventures to offer a wider variety of dairy products.

    “While the profits for the individual companies will experience a period of consolidation, both total revenue and profit margins are projected to continue their healthy growth trend,” added Li.

    Questions & Answers

    **What is the projected growth for Yili Group?**
    Yili Group is anticipating consistent revenue growth in the upcoming year, following a significant increase in the first half of the current year.

    **What key upgrades have been made to increase production?**
    Key upgrades include a 10,000-tonne increase in butter production at the Hokitika site, as well as an expanded skim milk powder output at the Glenavy site.

    **What collaborations have occurred between Westland and Oceania?**
    In the past year, Westland and Oceania have collaborated on sales and marketing to offer a broader range of dairy products.