Category: Research

Retail News Asia is committed to providing both local and global retailers with the latest Research throughout the Asian market. This on a daily base.

  • APAC battered by cyber attacks in 1H17

    APAC battered by cyber attacks in 1H17

    Asia Pacific was heavily hit by cyber attacks during the first six months of the year, taking more attacks than other regions in most threat categories, according to Trend Micro.

    Globally, Trend Micro detected 82 million ransomware threats and found that on average, 28 new ransomware families were created every month. The company also blocked more than 3,000 BEC attempts; and discovered and disclosed 382 new vulnerabilities.

    In the meantime, a new trend of cyberpropaganda reared its head in 2017 – cybercriminals started selling tools and services that helped create fake content, boost social media reach, and buy votes that can directly influence elections.

    Connected devices continue to be a problem too. In April, Trend Micro discovered the Persirai botnet targeting more than 1,000 Internet Protocol (IP) camera models. The company also found more than 83,000 exposed industrial routers and 28 exposed industrial robots.

    Out of the 82 million ransomware threats blocked, those targeting APAC entities accounted for 35.7% of all, the highest of all regions. This is followed by EMEA (25.24%), Latin America (22.66%), and North America (15.71%).

    The successive successes of WannaCry and Petya attacks reinforced the need for consistent patching for enterprises across all industries. Despite Microsoft releasing a patch in March for the vulnerability CVE-2017-0144 or EternalBlue, which WannaCry and Petya exploited, the attacks still infected thousands of computers in April and in June.

    Other noteworthy ransomware families that surfaced in the first half of the year included new variants of Cerber, an infamous ransomware now armed with anti-machine-learning capabilities; Patcher, which affected the MacOS; and the mobile ransomware SLocker.

    In the first six months of the year, more than 436 million malware detections were observed in the APAC region, surpassing the numbers in all other regions by a huge margin. APAC is followed by North America (324 million) and EMEA (169 million). The top three malware found in the region are DocDrop, DOWNAD, and WannaCry. The most hit countries in the region are Japan, Australia, and Taiwan.

    As industrial IoT devices continue to mushroom in APAC, the number of supervisory control and data acquisition (SCADA) system vulnerabilities is also increasing, providing fodder for malware attacks. Based on the findings from the Trend Micro’s Zero Day Initiative program, there exist malware specially made to target these connected systems.

    APAC also leads in the number of detections for online banking malware in the first half of the year, culminating in more than 118,193 malware discovered and blocked, four times more than EMEA (24,798) and five times more than North America (20,888). Japan, China, and Vietnam encountered most of the attacks.

    Trend Micro also found that more than 47 million malicious mobile apps were downloaded by users in APAC, much more than those from other regions. For instance, EMEA users downloaded 30 million such apps; the numbers are even lower in North America (eight million) and Latin America (six million).

    Exploit kits are another prominent threat in the APAC region, with a total of 556,542 detected within the six months, more than quadrupling the second place – North America (120,470).

    The most distributed exploit kits for the first six months in APAC are Rig, Magnitude, Sundown, and Nebula. Exploit kits normally target popular software such as AdobeFlash, Java, and Microsoft Silverlight. In 2017, connected industrial systems became a popular target for exploit kits too. Some of them can be used to deliver ransomware, such as Rig, Magnitude, and Sundown.

  • Mobile phone insurance market to hit $27b by 2020

    Mobile phone insurance market to hit $27b by 2020

    The global mobile phone insurance market is on track to grow to over $27 billion in revenue by the end of 2020, research from SNS Telecom indicates.

    The telecoms market research company estimates that the global market will account for $20.5 billion by the end of this year, and is in line to grow at a CAGR of around 10% over the next three.

    An SNS Research report notes that most major mobile operators, insurance specialists, device OEMs, retailers and even banks now offer insurance plans that specifically cover theft, loss, malfunctions and damage of mobile phones, with a particular focus on smartphones.

    Many policies also combine with enhanced technical support and additional protection features such as secure cloud-based data backup facilities to give consumers additional peace of mind.

    In light of the findings, smartphone insurance could be an additional avenue for mobile operators struggling with the continued erosion of their once-core voice and data revenue streams in the face of OTT substitution.

  • How fast fashion is emerging at pace in Vietnam

    How fast fashion is emerging at pace in Vietnam

    Vietnam is one of the fastest developing countries in the world with a huge population, and the number of middle and high income shoppers and consumers is steadily increasing.

    As a result, international brands such as Zara, H&M and Uniqlo have spotted a great opportunity for them to roll out new concepts and increase sales. Today, this is happening in a lot of industries, and fashion is one of them.

    Vietnamese people (especially women) take a lot of pride in their appearance, and with a growing middle class, more consumers have the cash to pay more for quality international brands and up-to-date products.

    Of course, price remains the most important factor when it comes to making a purchasing decision for most people in Vietnam, but fashion products also convey image and status which are very important in Vietnamese culture.

    The millennials (aged 15-35 years old), accounting for a third of the population, are now the country’s driving force, and have higher standards of fashion and higher exposure to global trends via internet/social media and travel experiences.

    This young population is key to the development of international fashion brands since they have the desire to buy, the money to do so, and are already sold on these brands as most of them know them and sometimes buy their products from overseas.

    These factors offer a good perspective for the entrance and development of international fashion brands in Vietnam and a platform to acquire new customers.

    Can foreign fashion brands really change the way Vietnamese consumers shop?

    Vietnam is following the global trend of standardization. These brands want to offer the same customer experience everywhere in the world, so they have strict guidelines to meet customer demands and roll-out concepts that are proven to work in multiple countries.

    This potential roll-out in Vietnam is a real opportunity for Vietnamese people to gain access to these products, some of which they are already aware of.

    Vietnam is a country where local brands and local makers can offer more unique and individualized products, but what Vietnamese want today, especially the younger generation, is to have international brands that offer modernity and a feeling of being part of the wider world.

    These brands may be offering mass market products, but that’s what young shoppers are aspiring to, and new store openings will likely drive increased traffic to the numerous shopping malls that have popped up in key cities.

    At a basic level, they will raise the shopping experience in Vietnam by offering a comfortable, spacious and premium shopping area with a clean store lay-out and iconic shopping bags to make the shopping experience easier and more interesting. Expect trendy music and cool staff to greet shoppers when they enter the store.

    Beyond this, another advancement we can expect from international brands is the adoption of technology to enhance the shopping experience.

    Fashion, as an industry, is continually evolving and fashion retailers must constantly innnovate to stay relevant. These brands have the financial backing and experience to roll out new technologies quickly, which will reshape the way Vietnamese shop for fashion. Expect to see iPads in the hands of staff helping customers to track down what they want, and even customers doing it for themselves at pop-up kiosks.

    Social media interaction, fashion competitions and mobile app membership could all be used by international retailers to drive interest in their stores. We can also expect their e-commerce websites to start offering a link between bricks and mortar and online. This will help reach a wider customer base (nationwide) when it’s hard to find spacious and affordable locations in Vietnam.

    Consumer expectations of foreign brands

    The fashion market is very scattered in Vietnam. Branded products account for a very small part of the total fashion/clothes market and are mainly targeted at the upper class.

    Currently most of the population buy either unbranded products made by local tailors, products from local fashion brands, or imported products from Thailand or even China. When international brands enter Vietnam, it is unlikely that they will be adopted by the major part of the population.

    Even if disposable incomes ares increasing, the low and middle classes are not ready to change their purchasing behavior to buy much more expensive products all the time.

    While these international fashion brands can be considered mainstream by global standards, they will probably be more considered “affordable premium” or even “premium” by most Vietnamese shoppers.

    If these brands want to make a real mark on the market, they must make themselves affordable to most of the population. However, if they do this they risk losing their main target consumers. As such it will be difficult for them to find the right positioning.

    There are some major mistakes these brands will have to avoid in Vietnam.

    The first mistake would be charging more for the same products than in other countries. Vietnamese consumers are connected/informed and will buy from overseas if the price in Vietnam is higher. We have already seen affordable brands become luxury brands when they entered Vietnam.

    The second mistake they have to avoid is to believe that Vietnam is a country where they can sell their collections from previous years: Vietnamese are looking for the latest trends and do not want old stock from other countries. These international brands will provide a new alternative to young consumers and will probably have great success in the short term if the price is not too disconnected from what they currently pay for local brands. The only question is whether these brands will fully replace what people currently buy or if they will just be bought as a treat, as an add-on to the current purchases of a specific demograph only.

    To sum-up, they should be affordable enough not just to attract a very small part of the population, not too cheap to stay aspirational, showcase the latest collections, offer an “international” look and feel, and take into consideration local tastes and sizes.

  • Mobility is the top priority in corporate travel

    Mobility is the top priority in corporate travel

    Four in five travel managers now believe mobility to be the biggest priority in managing corporate travel, according to Sabre Corporation‘s 2017 Asia Pacific Corporate Traveller study.

    According to the study conducted on corporate travel professionals from across 19 countries in the region, more than 43% of corporate travelers are also deviating from company policy ahead of the trip and 42% are making changes while traveling.

    When asked what it is they considered to be the biggest priority in managing corporate travel in their organization, 80% of travel managers said they believe mobility – from making a booking through a mobile device, to itinerary management, to staying in touch with their traveller via instant messaging – is their top priority.

    Two in three (66%) also quoted looking at alternative forms of payment technology as a high priority area for them.

    Today, new technologies are emerging at a rapid pace, ultimately opening up countless new revenue channels for travel companies to tap into. Travel managers have an opportunity to engage their corporate travelers on multiple devices at all points of the journey for a truly seamless trip.

    Product solutions that can seamlessly integrate booking, itinerary management, messaging, virtual payments, expenses reporting and travel risk management will help corporate travelers improve their traveller experience, whilst helping their organizations maximize efficiency, streamline expenses and improve compliance.

  • Why retailers want you to ‘click and collect’

    Why retailers want you to ‘click and collect’

    Retailers are starting to realise the benefit of combining online and in-store shopping. And by encouraging you to buy online first and collect later, these businesses are saving in a number of areas.

    Despite historically lagging behind the rest of the developed world, Australian retailers are beginning to embrace this approach. From groceries, alcohol, fashion and accessories, sports clothing and even automotive parts, more and more retailers are adopting this strategy. KPMG research found that by 2014, 64 per cent of customers in Australia had ordered online and picked up in-store.

    In Australia 42 per cent of retailers are now offering click and collect, and perhaps in response to the impending threat from Amazon’s entry, this number is up from 24 per cent in 2015. To supplement their pick up in store service, 38 per cent of retailers also allow customers to return their online purchases in-store.

    By comparison, 36 per cent of Western European and 31 per cent of North American retailers offer a click and collect service. The UK’s click and collect market is expected to grow 78 per cent by 2020, to £8.2 billion. This is not surprising given the intense competition among retailers within the British market and the strategic shift away from price to convenience.

    Why you click and collect

    Customers are embracing buying online and picking up in store because it offers them immediate gratification but with cost savings on delivery. Click and collect provides an immediacy that traditional home delivery usually can’t match, particularly in Australia where delivery times have traditionally been slow relative to international standards.

    Depending on the type of merchandise customers are buying, the costs of delivery can be high. In the US, 73 per cent of supermarket shoppers reported they would pick up items in store to avoid shipping costs and 30 per cent said they were not prepared to wait around for delivery of their online order.

    The sort of in-store pickup service also helps customers avoid problems with unprofessional delivery services and dodge the dreaded “card in the mailbox”, where parcels are returned to the depot.

    In-store pickup is especially handy for customers purchasing online just prior to the weekend or at peak shopping periods such as Christmas and Easter when timing is paramount. It can also help solve delivery problems for many customers living in apartment blocks, or living or working in properties that are difficult to access. More and more customers are finding it convenient to order online and then pick up their purchases during their lunch hour or on the commute home.

    Online shopping doesn’t allow for tactile purchasing – actually touching the products – in-store collection enables customers to check the quality, as well as assess the colour, style and size prior to leaving the store. Any problems can be resolved immediately in-store and returns can even be processed at the same time if products don’t meet customer requirements.

    With many retailers increasingly moving away from the traditional online “price wars” and recognising the importance of connecting with customers through multiple channels and touch points, click and collect is the natural progression to encourage customers back into physical stores.

    Why retailers are adopting click and collect

    Retailers can save a lot on click and collect. It reduces operational costs and leverages impulse purchases. Retailers are finding that in-store collection also provides them with additional opportunities to connect with customers and enhance the customer experience.

    One of the main benefits for retailers from shoppers who come into the store to collect their online purchases is that almost 50 per cent make an unplanned purchase. A study by company Bell and Howell of 530 shoppers found 49 per cent of customers were likely to purchase an additional item when picking up their online order.

    The International Council of Shopping Centres found 61 per cent of shoppers who bought items online and picked up in-store, made an additional purchase. This was higher for younger shoppers, with three-in-four millennials making impulsive purchases when popping in to collect.

    Offering click and collect also means customers feel more comfortable about returns as well. A report from packaging company UPS found 82 per cent of shoppers are more inclined to purchase online if they can return the product in store.

    Average parcel delivery costs in Australia are around $25 for a 5kg parcel (for next business day delivery) with courier services even more expensive, particularly for large and bulky items.

    The majority of retailers provide in-store collection free of charge, however some retailers are charging a fee for pickup in order to recoup staffing and storage costs. At the cheaper end of the scale Kmart charges a A$3 fee while Ikea Australia recently announced its fees which range between A$59 and A$149.

    “Bricks and mortar” retailers see click and collect as a way to differentiate and defend themselves from online players. In the US, Walmart announced last month it would offer discounts on products shoppers ordered online, but picked up in stores as a tactic to combat Amazon.

    Now Amazon has started its roll out in Australia, any edge over this competition will be an advantage. Deploying click and collect into a store allows retailers to compress sale time.

    Australian retailer, Super Cheap Auto recently announced shoppers could click and collect their online purchases within 90 minutes – and is now exploring how it can reduce that time down to 60 minutes.

    While shoppers continue to seek convenience, the frequency of online shopping (forecast to hit 12.5 per cent of total retail sales by 2025), will also increase. But getting the product to the customer will continue to be a challenge for retailers.

    So you can expect more retailers to adopt a click and collect strategy. If you can’t get the products to the customers, get the customer to the products.

  • Indonesia’s e-commerce market set to hit $130b by 2020

    Indonesia’s e-commerce market set to hit $130b by 2020

    Indonesia has the biggest and fastest growing online retail sector in Southeast Asia, according to Research and Markets.

    In this environment, RTB House, a provider of retargeting technology for advertisers, anticipates that Indonesia’s e-commerce players will increase adoption and reliance on retargeting to improve customer engagement and conversion rates, strengthen branding, and enhance ROI on their marketing spends.

    Personalized retargeting is a mechanism by which ads are tailored to the behavior and preferences of particular internet users.

    This form of online advertising helps keep brands on top of customers’ minds at every step of the customer journey, after they visit and left certain websites before they could make a purchase.

    The online consumption market has seen an alarming increase in e-commerce cart abandonment from 60% in 2006 to 78% in 2016, according to a Baymard Institute report. Retargeting technology will allow brands to prompt higher conversion rates among these users.

    The 2017 Digital Yearbook report by Hootsuite and Wearesocial estimates that 51% of Indonesians have access to the Internet. With mobile subscription standing at 142%, there is recognition that the country represents one of the largest online marketplaces in the world flanking China and India.

    Next to investment and manufacturing, the consumption market which includes e-commerce is among the largest economic segments in Indonesia. E-commerce is expected to grow to up to $130 billion in 2020, according to Indonesia’s Information and Communications Technology Ministry.

    Indonesia’s burgeoning digital environment presents companies like RTB House a lucrative opportunity to deliver advanced retargeting solutions to a wide array of customers including e-commerce, online travel sites and classifieds.

    A report by eMarketer and Interactive Advertising Bureau Singapore (IAB Singapore) forecasted digital advertising spending in Indonesia will double up to 20.5% of the total media ad spending by 2020 due to rapid internet adoption, particularly through smartphones.

    “We expect a substantial growth in Indonesian e-commerce players’ adoption of retargeting and what will really drive this is improved ROI on their marketing spend as our technology based on deep learning, helps to profitably and effectively drive new customer acquisition and entice existing users to their online marketplace,” RTB House country director for Southeast Asia  Chandra Kuncara said.

    “Deep learning is currently the most promising subfield of artificial intelligence. We believe these new digital ways will help our customers (marketers) succeed.”

  • APAC robotics market set to reach $66b in 2017

    APAC robotics market set to reach $66b in 2017

    Asia-Pacific’s robotics – including drones – and related services market is estimated to reach $66 billion this year, according to IDC.

    IDC expects spending to accelerate over the five-year forecast period of 2017-2021, reaching $162 billion in 2021 with a CAGR of 25.2%. This represents more than a projected 70% of the world’s total robotics market.

    “The convergence of robotics and artificial intelligence technologies are accelerating the development of the next generation of intelligent robots for industrial, commercial, and consumer applications,” said Jing Bing Zhang, research director of robotics at IDC Manufacturing Insights.

    “Intelligent robots with innovative capabilities such as cognitive interaction, self-diagnosis, and learning are emerging and driving wider adoption of robotics in many industries including manufacturing, resources, healthcare, retail, and so on.”

    China dominates the Asia-Pacific robotics market, with spending on robotics and related services expected to reach $74 billion in 2021. This represents 45.7% of Asia Pacific’s total spending in the next five years.

    From a technology perspective, Asia-Pacific spending on robotic systems is expected to grow to $92 billion in 2021.This includes industrial, service and consumer robots and after-market robotic hardware.

    Meanwhile, services-related spending, which encompasses application management, education and training, hardware deployment, system integration, and consulting, will grow to over $44 billion in 2021.

    In the telecoms sector, operators in multiple markets are trialing using drone technology to improve network maintenance and fault detection capabilities. Vendors such as Nokia are meanwhile testing applications for drones including the instant establishment of LTE public safety networks.

  • They’re only human: Big data made simple

    They’re only human: Big data made simple

    Big data has become one of the big buzzwords of retail in 2017. But many retailers remain confused by what it means and how to use it.

    Cue a team from Scotland who just three years ago founded a startup called Big Data For Humans.

    They weren’t your typical team of ‘tech guys’ but by a group of highly experienced retailers with decades of shop floor customer experience under their belts. Their mission: harness the power of big data to bring an unprecedented depth of insight into customers – not just as lines on a spreadsheet but as groups of ‘humans’ with unique tastes, needs and spending habits.

    “It’s one of those ideas that didn’t come to us overnight. It came to us gradually,” recalls co-founder and CEO Peter Ellen. “I was a retailer for about 20 years as a founder, and latterly as CEO, of a retailer in the UK which grew pretty quickly throughout the 1990s. One of the key rationales there was that we were really customer focused – we knew which customers delivered the most sales and we analysed carefully how we could use those relationships to drive growth in the business.”

    In 2005 Ellen co-founded a business called Maxymiser, a cloud-based software solution that tests, targets and personalises what customers see on a web page or a mobile app, substantially increasing engagement and revenue. It was ultimately sold to Oracle in the US.

    “We dealt with digital marketers as well as general marketers. What became very clear was that very, very few of those digital marketers actually knew who their customers were and some couldn’t even tell you what a customer was. One of them said ‘Is that like a non-unique visitor?’ And I said, no that’s like a human,” Ellen recalls.

    “The dictionary definition of a customer is someone with whom you transact. The culture being created around digital marketing is such that people are starting to categorise anyone as a customer… Someone who rocks up to your digital store or anywhere else, rather than someone who actually buys something.”

    Lurkers vs spenders

    “When I was a retailer it was very important to differentiate between the people who hung around your store and the people who actually spent serious cash. Online, I think, that problem is magnified many, many times over. And with retailers facing increasing costs of acquisition online, under constant pressure of dealing with occupancy costs offline, and with all the other marketing costs they’re surrounded with in multichannel, it is economically critical that retailers build relationships with the customers they have. Those people deliver 80 per cent of your profits and if you leave that process to chance – or leave them to an email marketer to knock out a couple of emails here and there on a random basis – you’re probably missing out on the biggest profit and revenue opportunity your retail business has.”

    Ellen is constantly amazed how many retailers have no idea who their customers are. “They guess who their customers are or they use technology invented in a bygone era to do the job.”

    The problem identified, the solution was already there. Or was it? The technology required to measure and monitor customer behaviour meaningfully is very technical. Analysts use complex tools to understand it, then there is an uneasy transition to transfer that information in a usable format to the people running the marketing and managing actual stores.

    “We realised retailers fell into two groups: One was retailers who didn’t bother doing anything with their customer data because it seemed like too nasty or scary a project to attack because of the technical challenges and the cost. Then there was a second group who had invested vast sums of money into customer analytics and employed analytics teams but often the rate at which they were able to get the insights into the hands of people who actually wanted to do something with it was really slow.

    “And the cost associated with that process was really high. So it was almost easier for retailers to go on ignoring their customers and carry on acquiring them over and over many times with different methods and losing money in the process.

    “So we thought: that’s not right. It’s economically unsustainable. We watched some businesses growing and growing through omni channel where the costs got higher and higher the bigger they got. And their profit shrank as their sales grew. We thought: It’s time to do something about that. If we can simplify the process in a smart way, we could help a lot of retailers around the world.”

    That’s how Big Data for Humans thus became the first company in the market to develop an automated customer insights platform which has transformed the way retailers understand their customers and sell to them, helping deliver deeper understanding of customers, more effective marketing, increased customer value and thus higher revenue. At its heart is the ‘Customer Graph’, which empowers business users at all levels to use automated customer insights to power their marketing.

    “We realised that one of the best ways to understand people in the modern world is through networks and that’s how we understand our place in social [media] and professional networks as well. So why don’t we do something similar to understand customers in the retail business?”

    Overcoming barriers

    “We found there were barriers to achieving that goal. Most of them around the fact using graphs is a more complex and technically difficult thing to do for an analyst but we realised if we could automate the process, and do it well, we could produce incredibly powerful insights that anyone in the marketing team could pick up and run with. We spent about a year on the basics of that before we launched the company and since then we’ve been growing in Europe and Asia very fast and getting some amazing results.”

    Since opening a Singapore office last October, the company has signed up Philippine Seven Corporation – the local operator of the 7-Eleven convenience store network – adding the brand to an international list already including AirAsia, Tesco, Selfridges and Jelmoli.

    “We are new to the region, but we have been talking to businesses in Thailand, Malaysia, Singapore and the Philippines. Hong Kong is definitely one of our next steps and we are speaking to some great businesses there.”

    Big Data for Humans works within retail sectors ranging from convenience stores to luxury and in size from small businesses to multinationals. The concept is easily scaled to fit different sized companies.

    “The smallest retailer we deal with would have tens of thousands of customer records, whereas the largest might have 60 million.” Data sources the company starts with range from loyalty-scheme information, or data collected from e-commerce receipts. “You generally find a retailer has some degree of data coverage.”

    The business hosts workshops in Europe and Asia in a bid to ‘demystify’ big data, the most recent held in Kuala Lumpur in May. During the two-hour sessions, retailers are challenged to rank their needs for information using a ‘playbook’. The retailers rank goals in order of priority, such as upselling, cross-selling, retention and win-back. They then drill down into subcategories like (within retention) seasonality prediction, implementing a VIP program, improving the conversion from first to second order and enhancing customer sentiment during the purchase process. There is no hard-sell at these seminars – rather they help retailers understand where their business is at and how using their own data can make a difference.

    For example, Tesco used data to cross-sell customers making weekly shops for shelf-stable foods into more regular shoppers buying fresh foods where the margins are higher. “Obviously they were buying fresh food, they just weren’t buying it from Tesco,” explained Ian Webster, chief customer officer at the Kuala Lumpur workshop. Using big data to drive a tailored marketing campaign, Tesco converted 15 per cent of ‘family supplier” shoppers into fresh food shoppers.

    Train-of-thought

    “In analytics there is something called a train-of-thought analysis where you sit an analyst down in front of data and everyone says: well that’s amazing – but what are we going to do now?,” explains Ellen.

    “Often they come up with interesting things that nobody can use. So in our software and our playbook we take a highly prescriptive approach to how you turn the data results you have in your business into money. Because that’s really all we are interested in. We guide people down that path and our software looks at what is the most important data you need in retail – we believe that’s mainly around people, products and money. And then we guide them through that process so that the output tells them who the customers are, what they want, what they might want in the future, how much they are worth, how often they shop, where they shop and all the main things they need.

    “And then through our methodology we help them plan a customer marketing program across their business and channels that should deliver an increase in annual revenue.

    “Big data provides a massive competitive edge because now retailers can actually plan their customer marketing communications and strategy in their overall business rather than in one channel. A lot of marketing is done in channel now where the company says: ‘I might send them an email on a Monday, an SMS on a Tuesday and a flyer on a Wednesday’, whereas our solution enables our clients to see what the opportunities are within the retailer’s customer base and how they can sell more.”

    Once they’ve worked that out, explains Ellen, they can calculate which channels are the best to contact the customer groups. It might mean direct relationships in the luxury sector, or reaching out by emailing special offers in high-volume businesses.”

    After only a matter of months in Asia, Ellen and his team are already seeing differences compared with European retailers.

    “Because Asian retailers often have experience running multiple locations and brands across multiple [territories], a lot have developed large databases for cross-brand marketing activities.”

    Big data is clearly in retailers’ lives to stay – and Ellen argues there is a need to understand it and make the most of it if retailers are to build a competitive edge – and more importantly optimise their sales.

    “It comes down to the economics of how you’re going to get more revenue from your customers. Retail is all about selling more to the customers you have.”

    “Embrace data,” adds chief marketing officer for Asia, Helen Wasserman. “You have to embrace it.”

    And study your customer life cycles, adds Webster. “A retailer might have customers who shop every week, every month or every five years. Treating those customers the same is not a good idea. If someone buys from you every three years and you don’t see them for a month, that’s not an issue. But if you normally see a customer every week and you don’t see them for a month, you should be worried.”

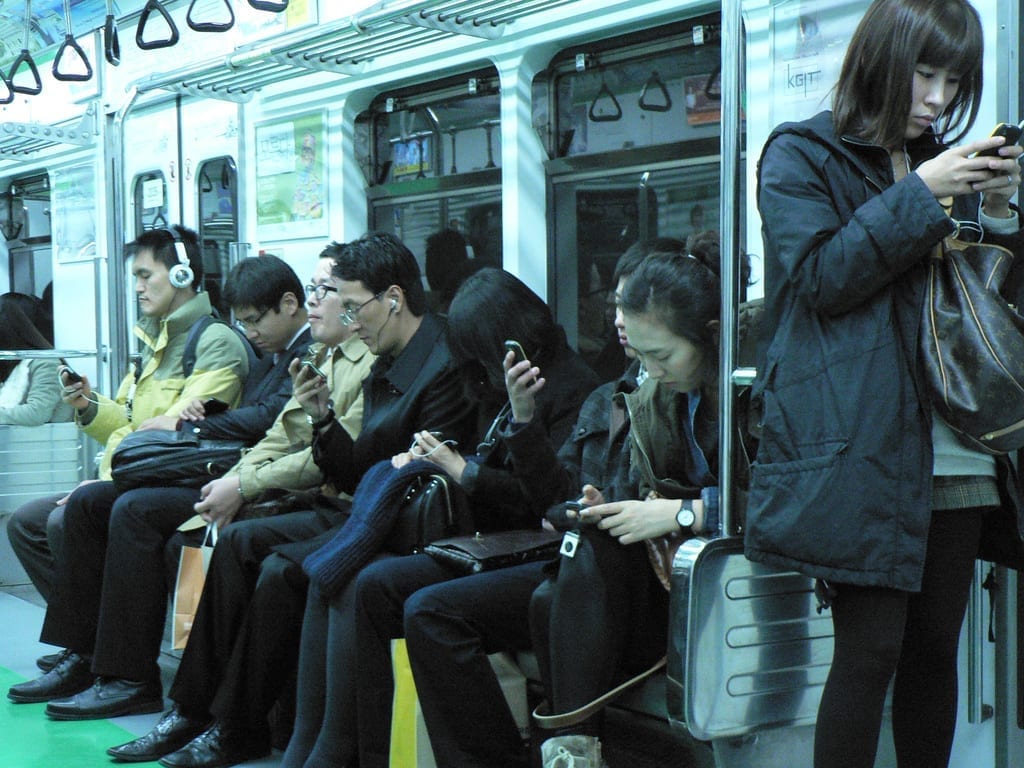
  • QR-code payments could dominate mobile payments

    QR-code payments could dominate mobile payments

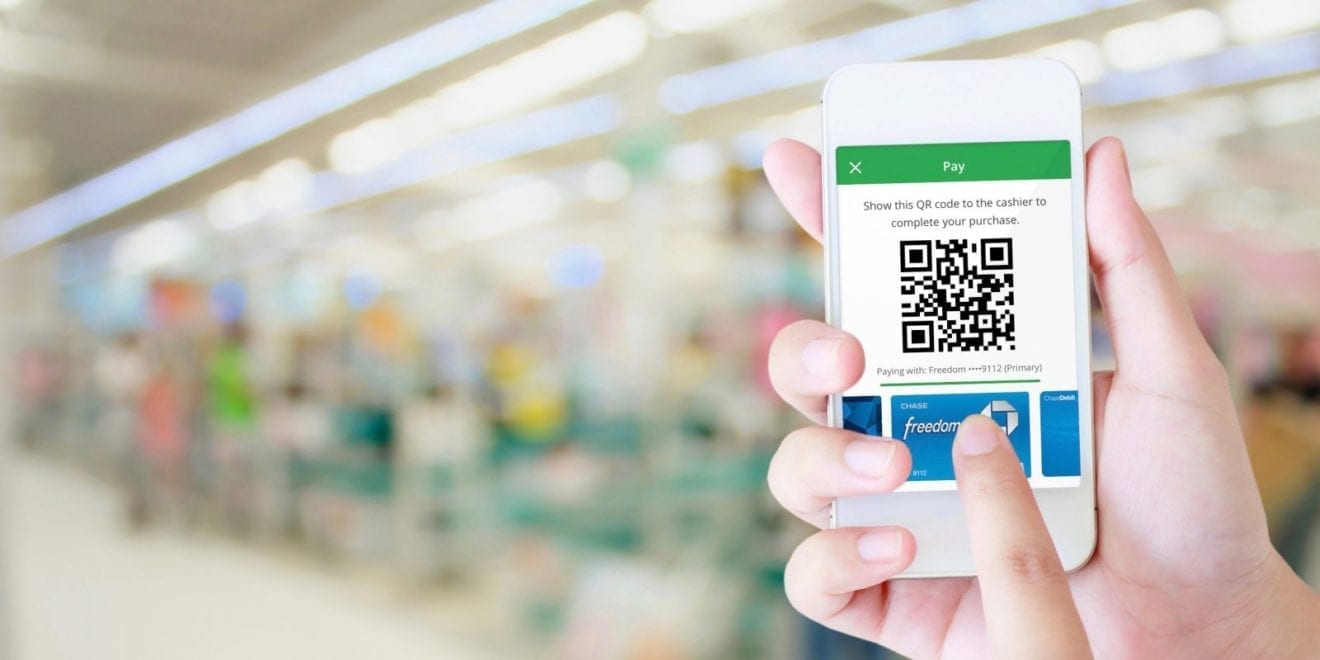
    QR-code payments have the potential to replace any other form of mobile payment according to new research.

    More than 1000 Chinese consumers and 60 decision-makers from global merchant companies were surveyed by mobile payments specialist Cancan and financial research company Kapronasia for the first global study covering the impact of Asian mobile POS payments worldwide.

    “Alipay and WeChat Pay, both based on QR code technology, are already dwarfing their Western counterparts tenfold with 750 million active users between them,” says Cancan MD Candice Koo.

    She says global merchants need to meet shoppers’ expectations regarding mobile payments. “Today that consumer is predominantly Chinese, but in year we could also be looking at Indians, Indonesians, Japanese and Koreans, who are already all following the Chinese trajectory.”

    “The rapid adoption of mobile payments by Chinese consumers domestically is well known, but not as much how they are using them abroad,” says Kapronasia director Zennon Kapron.

    The 2017 Mobile Payment Survey: Chinese Consumers Abroad investigates how mobile payments methods such as Alipay and WeChat Pay are shaping Chinese consumer expectations toward shopping outside of China. It also investigates global merchant preparation for this phenomenon.

    Key findings include:

    • Mainland Chinese consumers expect to spend more with mobile payments this year and next when travelling abroad, overriding the use of cash or credit cards
    • Nearly half of the consumers surveyed made between 10 and 30 per cent of their overseas shopping purchases with QR-code mobile payment methods; one-third paid for more than half their purchases in China with mobile
    • Fashion and cosmetics/skincare products are the categories most likely to attract mobile payment purchases
    • Consumers chose mobile payments for transaction convenience and the ability to track purchases in real time; they also appreciate not needing to carry cash and credit cards while travelling
    • More than a third of merchants who accept mobile payments say this payment method contributes to at least 3 per cent of their global sales, with some merchants experiencing a share as high as 25 per cent.

    The report says customer demand is driving merchant adoption of mobile payments, while merchants are attracted by the speed of mobile-payment transactions.

  • Inflight Wi-Fi essential for 2 in 3 APAC travelers

    Inflight Wi-Fi essential for 2 in 3 APAC travelers

    Two thirds of airline passengers in Asia-Pacific feel that inflight Wi-Fi is not merely a luxury but a necessity, according to Inmarsat-commissioned research.

    A survey of travelers in the region, conducted by market research company GfK, found that 79% are willing to pay for inflight connectivity even on short leisure flights. In addition, 61% believe quality inflight Wi-Fi is more important than onboard entertainment.

    The survey found that inflight broadband is changing the airline industry and transforming travelers’ expectations of the onboard experience.

    Inflight Wi-Fi is becoming so important that over half (52%) of passengers in the region say they will stop using their preferred airline within the next year if it does not introduce the technology.

    Passengers who have experienced high-quality in-flight Wi-Fi also rate it as the third most important consideration when choosing an airline, behind ticket price and flight slots.

    Passengers in China are more likely to be conscious of the quality of Wi-Fi (55%) than those from other countries in the region. Notably, the top three airlines that passengers expect to offer in-flight Wi-Fi and eventually lead the inflight connectivity market in APAC are airlines from China – Air China (46%), China Eastern Airlines (22%) and China Southern Airlines (21%).

    “Good quality Wi-Fi in the air is changing the way people think about flying. Whether using the time to work, to connect with friends and family, or to pass time shopping or viewing entertainment, the availability of inflight broadband has become a major factor when choosing an airline,” Inmarsat Aviation vice president for APAC Otto Gergye said.

    “It’s clear the opportunity that connectivity presents to airlines cannot be underestimated. Airlines in Asia Pacific are recognising this, and can now take advantage of having a high quality onboard Wi-Fi option available in the region.”

  • Blockchain: Revolution in supply chain?

    Blockchain: Revolution in supply chain?

    Supply chains revolutionized how our society runs, now supply chains are being revolutionized. The name of the NEW game: blockchain! Supply chains can lack transparency and traceability. Two things at which blockchain is great at.

    Systems work based on transactions. They are built on a distributed blockchain ledger can record the transfer of goods as transactions. This transparency can ensure the cost of goods will more accurately reflect the actual cost of manufacturing them. Issues such as use of forced labor and illegal sourcing of materials can potentially disappear. But despite the hype and its potential, it could take a decade or more before the technology achieves its full potential.

    We have a few interesting examples. Provenance, a UK-based startup, works with clients so they can use its blockchain-based technology to “share your product’s journey and your business impact on environment and society.” Mining giant BHP Billiton is using the technology to track mineral analysis done by outside vendors. The startup Everledger has uploaded unique identifying data on a million individual diamonds to a blockchain ledger system to build quality assurances and help jewelers comply with regulations barring “blood diamond” products.

    Walmart is working with IBM and Tsinghua University, in Beijing. They want to follow the movement of pork in China with a blockchain.

    Long term what we should have in mind:

    Potential to disrupt many industries
    There are parallels between this global-scale distributed technology and previous technology-driven transformative waves, such as the web and the internet. Early technology adoption of blockchain will progress over the next three to seven years, but mainstream adoption across the supply chain and at scale is likely 10 or more years away. Similar to RFID in its early days, business processes and standards must be resolved before blockchain can reach its potential.

    It is not a replacement for database tech
    Many believe, but they are wrong, that blockchain is a replacement for traditional database technologies — it lacks the ability to create, read, update and delete information. For the immediate future, traditional database management tools and platforms will continue to prevail in supply chain, where data is created, maintained and consumed largely internally. Database capabilities, however, will increasingly need to scale and integrate across a broader number of supply chain network partners and ultimately customers. There is where blockchain is best.

    You can’t just buy a solution!
    There is no blockchain solutions to buy for supply chain use at the moment. There continues to be a lot of hype, with few even partially deployed and very limited prototypes, for which firmer results or tangible uses cases are still be reported. Only organizations that are especially risk-tolerant and early adopters of technologies should consider supply chain management blockchain initiatives over the next two to five years.

    Stormy waters ahead
    There are more challenges than we can mention here. Blockchain technologies and associated supply chain best practices bring adoption challenges, including a lack of standards, robust platforms, scalable distributed consensus systems and interoperability mechanisms.Scalability across supply chains will need to be carefully planned.

    Laws and regulations — which vary from country to country — also pose a challenge to global scaling of blockchain. Before governments can be convinced to support this effort, industry must agree on best practices and standards of technology.

    Adoption too late or too early as part of an extended supply chain and supply chain maturity progression may do damage to the entire organisation.

    Also there’s the need to overcome embedded corporate thinking. Business leaders and organizations need to open up to the sharing of information with mainly unseen network partners.

    In conclusion
    Blockchain is presently at the peak of Gartner’s Hype Cycle, which means the next stop is the Trough of Disillusionment. In supply chain circles the technology is suddenly drawing serious interest, in part because of IBM’s recent push to go public with pilots including one with Maersk and another with Walmart.

    As RFID promised to do, blockchain could one day provide certainty on the exact source of every ingredient in every jar, in every case, on every shelf and at all times. Was your palm oil sustainably sourced? Are the cherries in your ice cream organic? Are the avocados in your salad imported from Mexico? Also reminiscent of RFID, however, is a decent amount of uncertainty about the timing of the business case.

    Envisioning a digitally enabled supply chain strategy is a must-do activity for everyone. Fitting blockchain into that strategy now means listening more than talking. Listen to your colleagues in corporate IT who are likely ahead of you since they’ve often faced this topic already with financial transactions. Also, listen also to vendors like IBM who are invested in establishing a market for this technology and can afford to find and foster pioneering users like Walmart and Maersk.

    Blockchain may still be down the road, but its potential demands your attention now.

  • The economics of the money-back guarantee

    The economics of the money-back guarantee

    “Returning the product to Amazon ASAP!” complained one disgruntled Amazon customer as they gave a one-star review for a digital camera on the company’s site. This is despite the same product having an average rating of four-and-a-half stars out of five from 242 other customers.

    Companies like Amazon aren’t just ignoring these disgruntled customers and their product-returning ways. In fact, retailers are increasingly offering extra services such as warranty plans, free shipping and guarantees to reassure them. Selling with the “money-back guarantee” is a prime example of this.

    This is because the economics of the money-back guarantee can work for retailers. These businesses allow customers to return products that do not meet their expectations — as a result of poor quality or a mismatch in taste — for a full or partial refund. Essentially offering their customers an insurance against the perceived risk of the product.

    And research shows these retailers make a profit with this type of guarantee, given specific conditions. Other research also shows the money-back guarantee increases customers’ feeling of satisfaction with their purchase experience, making them likely to return to the store.

    This type of guarantee is particularly important for retailers who sell products online or through mail-order catalogues. This is because customers can’t enjoy the benefits of the traditional “touch-and-feel” shopping experience, to reassure them they are making the right decision.

    Customers rorting the scheme

    Customer returns cost retailers more than US$260 billion (equivalent to 8 per cent of total retail sales) annually in the United States alone. The return rates vary significantly by category, and by channel type. It can reach as high as 35 per cent for high fashion apparel sold in traditional stores, and the rates are higher again for internet and catalogue sales.

    However, in most cases, the returned products are not defective. Customers abuse the money-back guarantee, so much so that buying a product with the intention of returning it has become a trend known as wardrobing or barrowing. In the US, fraud associated with returns costs retailers around US$2 billion during the holiday season alone (US$9 billion annually).

    Retailers try to get around this by offering partial instead of full money-back guarantees for products. The refund is usually less a “restocking fee” charged for returns.

    For example, compare the 30 day money-back guarantees from two Australian furniture retailers, Zanui and Rogerseller. Zanui offers a full refund, whereas Rogerseller charges its customers a 15 per cent restocking fee (it pays back only 85 per cent of the selling price rather than the full amount).

    In most cases, restocking fees can range between 10% and 20% of the original purchase price, some even as high as 50 per cent.

    A survey by professional services company Accenture reported that in the computer electronics industry, most customers returned their products because they simply “did not meet expectations.” More specifically, for 68 per cent of returns, there was “no trouble found” by the customers; 27 per cent of the products were returned due to “buyer’s remorse”.

    And only 5 per cent of the products returned were truly defective. However, regardless of the reason, returned products cannot be sold as “new,” even though the product could be new in the sense that it was never used.

    Major consumer electronics retailers such as Best Buy and Walmart restock these returned items and sell them as “open-box items” at discounted prices. Open-box simply means the product is marked as being opened or used previously. A retailer’s ability to sell returned products as open-box creates an opportunity to attract more price conscious consumers.

    The downside of such product differentiation is that open-box products can have a negative impact on the demand for the new products in a store. The retailer might also have to incur additional costs for handling returns and repackaging them as open-box.

    Making or losing money on the money-back guarantee

    Balancing the benefits and costs of the money-back guarantee is a delicate task for retailers. In studying the guarantee we worked out how retailers could use it to increase sales and profits.

    We looked at product pricing, refunding and inventory stocking decisions in money-back guaranteed sales. We took into account uncertainty in demand, the possibility of a customer’s dissatisfaction with the product after purchase, as well as the lower value customers place on an open-box product, relative to brand new products.

    Using this model, we figured out the best prices retailers could use reselling returned products and the restocking fees to encourage or discourage returns, for the highest possible net profit.

    Even though reselling returned products meant less stock for the retailer it also reduced inventory-related costs adding to profits. In essence, retailers can claim back at least some of the costs associated with return fraud, with reselling.

    In areas of retail with higher risk of returns, the temptation is to tighten returns policies, to limit them. This is especially true for highly innovative products, new technologies, or fashion-driven products (especially high-end ones).

    Interestingly, our study shows that reselling returns complements the money-back guarantee. So these type of high-risk products are likely to give retailers the most benefit, when they are resold after being returned.

    Retailers also feel the benefit of reselling when there are more price conscious customers who are more inclined to buy a product that is being resold, because it’s at a discount.

    So the economics of the money-back guarantee can work for retailers by improving brand value and through reselling via open-box products

  • The State Of The Aging Craft Beer Industry

    The State Of The Aging Craft Beer Industry

    The craft beer industry may still have some few more good years left in it, but its old has started showing after years of enjoy double-digit growth over the past years. Single-digit growth only happened last year and with it come the concern that the industry is set for a poor performance.

    While several factors played a hand in the slowdown, it is most likely that the craft beer industry from here on will be on a downhill journey.

    The Industry Is Aging Well

    As of 2016, the Brewers Association said the growth of the craft beer industry slowed shy of 6%, which was a seven digit drop from that of 2015 and a twelve digits from that of 2014. Well, nothing good lasts forever; likewise, no business can register a torrid growth forever. But it can be said that the craft beer industry did last longer than expected and its reached full maturity. Now focus is on what the future hold for the industry’s producers.

    From the chart above, it’s clear that the industry as seen the last of its good days and it most likely is a victim of its success.

    Boston Beer may not be the first in the craft beer industry but it rapidly became the face of craft beer product. Its success was the start of many other home brewers making their leap in the big-league. The Samuel Adams brands also contributed to the cultural changes that lead to changing how a beer tasted a transition for the weal amber-color beer that were in mass production done by Miller, Molson Coors, and Anheuser-Busch InBev to the dark and richer-tasting brew.

    Bound To Be Bigger Than Ever

    With more than 5,300 breweries in operation, that is an outstanding number that the country has seen it is history. And of these, 99% are in the craft brewing industry. That is a significant figure, a huge leap from that of less than 2,000 breweries in 2011. Based on that information, the breweries growth stands at around 21% annually. Is the craft beer industry running its last leg?

    Boston Beer attribute to its depleted sales to wholesalers and retailers over the last twelve months to the increased demand for shelf space. The wholesalers and retailers are considered as the bridge between the producers and the consumers.

    The growth of the craft breweries caught the attention of mega-brewers but their sales soon took a similar direction, flat-lining and taking a decline soon after. To answer the poor turn of events, Molson launched Blue Moon and Anheuser-Busch followed suit with Shock Top; nevertheless, the domestic beer sales never improved. So, they began purchasing the smaller players in the industry and Anheuser-Busch bagging much of the competitions. Other big players that made significant investments in the craft brewery industry include Constellation, Heineken, and Molson Brands (NYSE:STZ).

    The decline seen in the brewing of craft beers may be attributed to the turn of events stated above. Nearly 1.2 million barrels have been taken out via the acquisitions must of which was from regionals with much of this coming from micro-breweries and brewpubs. As such, the Brewers Associated noted, based on that data, that the craft is bound to get even smaller. This craft beer industry report has an even more in-depth look into this.

    Continuing To Take Market Share

    According to the trade group, a craft brewery qualifies to be considered as such if it produces around six million barrels annually and with a control or ownership by a mass brewer that is below 25% and mostly uses traditional brewing ingredients and methods. Ballast Point Brewing was a known craft brewer; it was bought by Constellation Brands, an acquisition that saw it pulled out of the group. The same fate befall all the other craft beer makers that were acquired by Anheuser-Busch over the past years.

    The remaining breweries, as of 2016, account for the 1.4 million barrels recorded during the same year which was higher than the volume of barrels taken out and a sign of a better things still to come for the industry. Nevertheless, the many craft brewers still in play contributed to an increased competition for the limited shelf space.

    A Shakeout In The Works?

    The craft beer industry is most likely going to consider some reductions and making alliances over the next years. 97 breweries close in 2016, 29 more than what was seen in 2015 and 51 the year before that. The numbers may seem alarming but the market still has many old players and new ones who keep coming in; thus the increased competition only promises to make it harder for brewers to operate profitably.

    Ultimately, the industry will have to consider a craft beer shakeout which may help keep the breweries that are in the pink operational even as the few local favorites fade off.

  • Korean online shopping growth surge as retail sales stumble

    Korean online shopping growth surge as retail sales stumble

    Online shopping is experiencing a growth surge, accounting for close to 20 percent of all retail sales in the first quarter of this year.

    Retail transactions in the three months to March totaled 96.56 trillion won (US$85.83 billion), a growth of 4.7 percent from the same period a year before, according to Statistics Korea. The sum of online shopping was 18.21 trillion won, or 19 percent of the total.

    This represents a 19.6 percent leap from the same quarter of the previous year and the largest total since related record keeping began in 2010.

    The ratio of online sales to all retail sales has grown in double digits every quarter since the fourth quarter of 2012, when it was 10.2 percent. It reached 17.7 percent in the last quarter of 2016.

    In monetary terms, the amount of transactions has also expanded by double digits, increasing the growth pace from 11.2 percent in the first quarter of 2013 to 23.2 percent in the third quarter of 2016. It fell to 19.6 percent in the first three months of this year.

    The mobile sector played a critical part in contributing to online shopping, accounting for 59 percent of the sales in March.
    “Mobile shopping has grown with the wide penetration of smartphones, and shopping malls have also been pushing their mobile platforms,” a Statistics Korea official said.

    Such high performance of online sectors contrasts with sluggish figures in the overall retail market. Retail sales gains that reached over 10 percent in the first two quarters of 2011 shrank to 0.6 percent by the second quarter of 2013. They bounced back somewhat to 3-5 percent last year.

    Sales at department store, the strongest source of offline shopping, have backtracked. The monetary amount of transactions fell 1.5 percent in January from a year before, 5.6 percent in February and 3.5 percent in March. The figures showed a decrease of 2.2 percent in April and 4.6 percent in May.

  • New Zeeland among world’s technology elite

    New Zeeland among world’s technology elite

    New Zealand is among the world’s stand out digital economies, according to the Digital Evolution Index 2017 launched yesterday by The Fletcher School at Tufts University and Mastercard.

    The research tracks the progress countries have made in developing their digital economies and integrating connectivity into the lives of billions – and put New Zealand with a group of digital elites – characterised by high levels of digital development and a fast rate of digital evolution.

    “We all know technology can do more to improve economies and make our lives better, but growth is only achievable if everyone has confidence in the developing ecosystem,” said Ajay Bhalla, president, global enterprise risk & security, Mastercard. “In our pursuit of a truly connected world, trust and security are critical to successful digital development.”

    With nearly half of the world’s population online, the research examined the development of 60 countries, demonstrating their competitiveness and market potential for further digital economic growth. The Index measures four key drivers and 170 unique indicators to chart each country’s respective course:

    •         Supply (or internet access and infrastructure)
    •         Consumer demand for digital technologies
    •         Institutional environment (government policies/laws and resources)
    •         Innovation (investments into R&D and digital start-ups etc.)

    “Adoption, the quality of digital infrastructure and institutions, and innovation collectively shape a country’s digital competitiveness, but governments also play a key role,” said Bhaskar Chakravorti, senior associate dean of international business & finance at The Fletcher School at Tufts University. “The report also found that consumers’ trust in digital technologies correlates with digital competitiveness.”

    According to their overall digital evolution scores, Norway, Sweden, Switzerland, Denmark, Finland, Singapore, South Korea, the United Kingdom, Hong Kong, and the United States make the top ten list of advanced digital economies.

    The research found developed countries including in Western Europe, the Nordics, Australia and South Korea have a history of strong growth, but their momentum is slowing and are at risk of falling behind. Countries such as South Africa, Peru, Egypt, Greece and Pakistan face significant challenges, constrained both by low levels of digital advancement and a slow pace of growth.