Retail News CRM

Tag: Research

  • The rise of the IoT marketplace is under way

    The rise of the IoT marketplace is under way

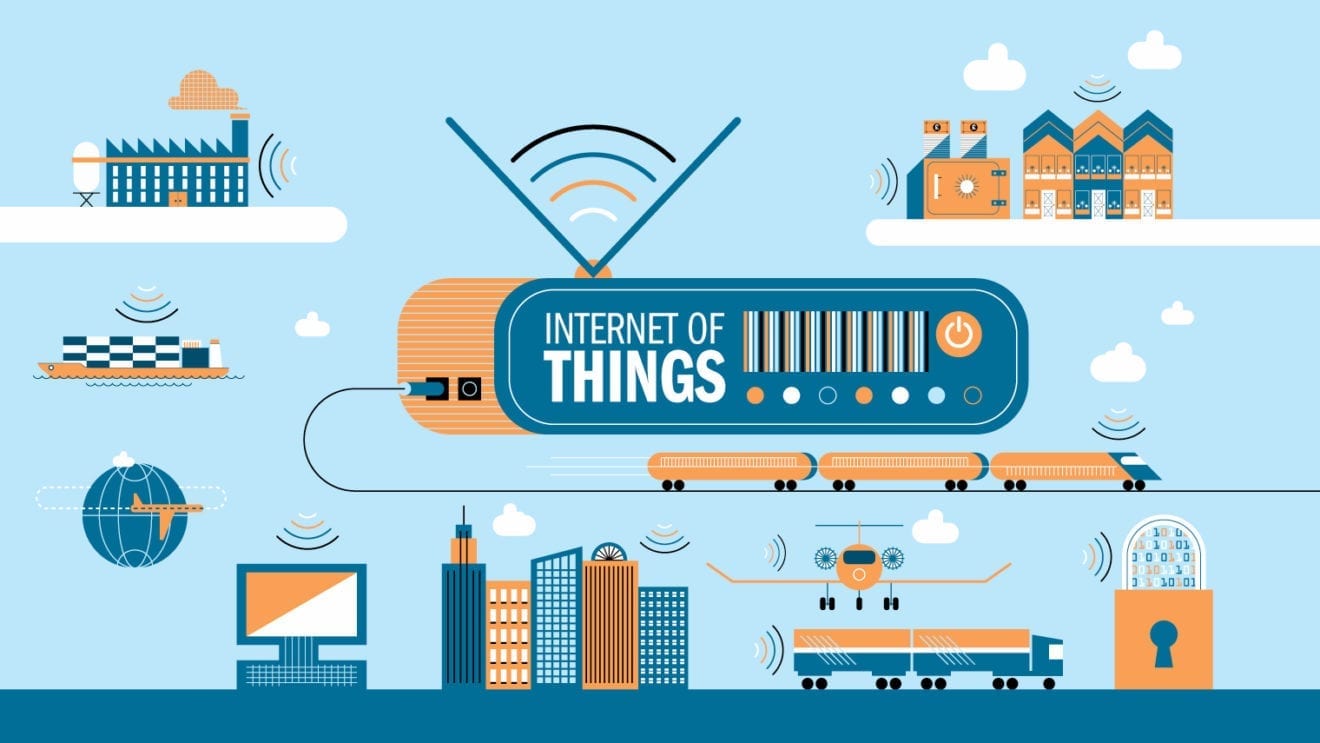
    As companies seek to transform themselves with IoT technologies, they are confronted by an incredibly complex and diverse supplier market from which to build IoT solutions, according to ABI Research.

    To address this challenge, suppliers are leveraging ecosystem partnerships to provide end-users with a one-stop-shop portfolio of hardware, software, and services.

    These emerging IoT Marketplaces not only simplify IoT solution creation and adoption, but they also facilitate supplier and buyer interactions ultimately creating open networks that encourage innovation.

    “The IoT supplier landscape is scattered right now with a diverse array of companies offering a myriad of complex components and solutions,” ABI research analyst Ryan Harbison said.

    “IoT Marketplaces, are a response to this complexity designed to reduce the friction buyers face when adopting and implementing IoT solutions.”

    ABI Research finds that to reduce the friction that enterprise developers encounter when developing IoT solutions, IoT Marketplaces need to effectively address all components of the IoT value chain.

    While some IoT Marketplaces currently offer all solution components, many do not have comprehensive offerings. Suppliers are currently working to formalize and expand marketplace offerings and in some cases, integrate them with resources and programs already in place to fully leverage existing relationships.

    “IoT Marketplaces allow suppliers to build an IoT offering centered around their core offerings,” continued Harbison. “These marketplaces are particularly effective when they are built around a single connection point, such as a platform or gateway, because that simplifies the work enterprise developers need to do on both the front and back end.”

    ThingWorx successfully leveraged its platform alongside its partners’ expertise to offer a comprehensive supplier exchange. Aeris’ Neo Marketplace provides enterprises not only end-to-end IoT solutions, but also access to support services, APIs, and network services tools.

    Dell, likewise, worked with its partner program to center its end-to-end marketplace offerings on its IoT edge gateways. Companies like Libelium, Sierra Wireless, and Telus offer solutions in the form of vertical-specific application development and solution kits aimed at enterprise developers.

    Other companies like Amazon Web Services and Microsoft currently limit their IoT Marketplace offerings to software solutions, but both are looking to integrate their existing program into a cohesive end-to-end IoT offering.

  • Cloud boom fuels demand for identity-as-a-service

    Cloud boom fuels demand for identity-as-a-service

    The rising adoption of cloud computing, especially among small and medium organizations, is fueling demand for new identity and access management business models such as Identity as a Service (IDaaS), Frost & Sullivan said.

    IDaaS will strike a balance between on-premise and cloud identity management, as well as significantly lower the cost of ownership of IAM solutions.

    The research firm noted that IAM challenges are more business-centric than technology-centric. Segments such as administration, authentication and auditing are developing technologies to improve service accuracy and cost efficiency.

    Emerging services like Platform-as-a-Service (PaaS) and Infrastructure-as-a-Service (IaaS) are contributing heavily to the growth of IAM technologies.

    “The shifting of enterprise solutions to the cloud has created a complex architecture that requires more advanced IAM solutions than the ones currently offered by traditional identity management vendors,” noted Frost & Sullivan TechVision Industry Analyst Swapnadeep Nayak.

    “The emergence of IDaaS has proven beneficial to enterprises, as it will assist with regulatory compliance, reduce the expenses involved in extending on-premise solutions to the cloud, and support the same features as enterprises’ legacy systems.”

    As most of the recent IT trends have been mobile centric, IAM solution providers need to ensure their innovations are mobile friendly to attract the attention of enterprises. Supporting cross-platform visualization and advanced analytics, as well as portable biometric technology, will give a huge boost to technology adoption rates.

    “Biometric authentication is a key area that is experiencing significant technology development, especially with regard to accuracy levels of validation and flexibility of usage,” noted Nayak. “Analytics is also growing rapidly due to the emergence of futuristic solutions like neural networks and machine learning.”

  • Apple to open first R&D center in Indonesia this year

    Apple to open first R&D center in Indonesia this year

    Good news to Apple fans in Indonesia — Apple will finally bring its flagship phones to the country this year. The company will open the doors to its first R&D center in the country in the second quarter of this year in the city of Tangerang, reports The Jakarta Post. This means Apple will officially be able to retail its iPhone 7 and 7 Plus in Indonesia now, which the company reportedly plans to launch today.

    The move is part of Apple’s efforts to become compliant with local regulations which stipulate that a foreign phone maker needs to have at least 30 percent domestic content in order to sell phones in the country. The company committed to invest $44 million to set up an R&D centre in the country last year.

    Apple did not immediately respond to Retail News’s request for comments.

    Apple is not alone in moving to boost local content in Indonesia so as to meet regulations and be able to retail its phones in the country. It was reported in November 2015 that Lenovo began producing its 4G phones in the country as part of the company’s commitment to meet the regulation.

  • Global smart transportation market expected to reach US$237,701 million by 2022

    Global smart transportation market expected to reach US$237,701 million by 2022

    According to a new report published by Allied Market Research, titled, Smart Transportation Market by Solution and Service: Global Opportunity Analysis and Industry Forecast, 2014-2022,” the global smart transportation market was valued at US$63,667 million in 2015, and is expected to reach US$237,701 million by 2022, growing at a CAGR of 18.6 percent from 2016 to 2022. Cloud services segment is anticipated to dominate the market during the forecast period. Europe was the dominant region, accounting for approximately 33 percent share of the smart transportation market revenue in 2015.

    Rise in number of vehicles results in high traffic congestion, leading to the requirement of smart transportation network to ease traffic congestion, enhance the safety, sustainability, and efficiency of transportation network. In addition, most consumers are now demanding smart transportation options that can easily navigate the roads with the least possible scope of congestion. The increasing government support and investments towards development of smart cities provides a major boost to the market. For instance, the Government of India aims to develop 100 smart cities by using smart technology to improve the efficiency of services and meet the residents’ needs. However, the need for high capital investment, owing to the complete restoration of the existing transport system, restrains the market growth.

    “Smart transportation system is a necessity, owing to the rising demand for efficient transportation networks worldwide. These systems have witnessed the highest growth in cloud services segment, due to the advancement in technology and increased demand for storage, access, and management of data remotely. In addition, parking management systems are expected to increase their market share at a notable rate. Asia-Pacific and Brazil possess enormous opportunities for the players operating in the smart transportation systems market.” states Sheetanshu Upadhyay, research analyst at Allied Market Research.

    The solutions segment is divided into hybrid ticketing management system, parking management & guidance system, integrated supervision system, and traffic management system. In 2015, traffic management system accounted for the largest revenue, owing to rapid urbanization and the emerging concept of smart cities and smart traffic. However, the parking management system market is anticipated to witness the highest growth, with a CAGR of 18.8 percent from 2016 to 2022.

    The service segment is further divided into business, professional, and cloud services. In 2015, cloud services generated the largest revenue, owing to rapid increase in demand for cloud services smart transportation system. However, this segment is anticipated to witness the highest growth over the forecast period, with a CAGR of around of 18.8 percent  from 2016 – 2022.

    Europe held the largest market share in 2015, and is anticipated to maintain its dominance throughout the forecast period. This is due to increase in demand for smart transportation and concern of users towards the environment. Additionally, investments in emerging smart cities would create growth opportunities for the smart transportation market in the region.

  • 86% of APAC organizations to adopt IoT by 2019

    86% of APAC organizations to adopt IoT by 2019

    Nearly nine in 10 (86%) organizations in In Asia-Pacific will have some form of IoT in place by 2019, according to results of a survey from Hewlett Packard Enterprise’s Aruba.

    Organizations across the enterprise, industrial, healthcare, retail and municipality sectors globally are adopting IoT to leverage the business benefits of enhanced efficiency and innovation, the research shows.

    But Aruba’s study warns that connecting thousands of things to existing business networks will open up new security challenges.

    The research also found that although 97% of the 1,150 respondents from Asia-Pacific (Australia, China, India, Japan, Singapore, and South Korea) have an understanding of IoT, many are still unclear of the exact definition of IoT and what value it brings to their organizations.

    In his new eBook, ‘Making Sense of IoT’, commissioned by Aruba, technology visionary Kevin Ashton—who coined the term ‘Internet of Things’— presents the following definition: “The ‘Internet of Things’ means sensors connected to the internet and behaving in an internet-like way by making open, ad hoc connections, sharing data freely and allowing unexpected applications, so computers can understand the world around them and become humanity’s nervous system.”

    When examining the business benefits of IoT, Ashton discovered that actual gains from IoT exceeded initial expectations on all fronts. In Asia Pacific, this ‘expectations dividend’ is most evident in two key performance areas: profitability and business efficiency.

    For instance, 35% of business leaders cited significant profit increases after deploying IoT, a 20% increase from those who projected a large profit gain from their IoT investment (15%).

    Similarly, while 39% of executives expected their IoT strategies to yield huge business efficiency improvements, actual results show that more than half of those who implemented IoT (51%) has experienced great business efficiency gains.

    “With the business benefits of IoT surpassing expectations, it’s no surprise that the business world will move towards mass adoption by 2019,” said Chris Kozup, VP of marketing at Aruba. “But with many executives unsure of how to apply IoT to their business, those who succeed in implementing IoT are well positioned to gain a competitive advantage.”

  • What do Vietnamese people love to buy online?

    What do Vietnamese people love to buy online?

    In contrast, fast-moving consumer goods including cosmetics, food and other household products have been slower to gain in popularity among internet shoppers. For these, Vietnamese people still prefer to go to stores and seek advice from shop assistants.

    With Vietnam becoming more “connected” and nearly half of the population with easy access to the internet, Vietnamese purchasing habits are changing.

    “The online retail ecosystem is fast evolving. The whole retail experience is changing. Today’s shoppers are incorporating digital touch points along the entire path to purchase,” said Roberto Butragueño, associate director at Nielsen Vietnam.

    According to the survey, customer loyalty is varied. More than half of respondents who had purchased travel services or books/music/stationery online admitted they would buy those more often online than in store. Event tickets, which attract only one-fourth of online customer, have become the favorite destination for second time purchasing.

    However, once an online shopper does not necessarily mean always an online shopper. The story is different for fashion, electronics and cosmetics.

    The survey’s findings are based on more than 200 respondents with online access in Vietnam. Survey responses are based on claimed behavior, rather than actual metered data.

  • Connected things on pace for 31% surge in 2017

    Connected things on pace for 31% surge in 2017

    Globally, 8.4 billion connected things will be in use in 2017, up 31% from 2016, and will reach 20.4 billion by 2020, according to projections from Gartner.

    Total spending on endpoints and services will meanwhile reach almost $2 trillion in 2017, the research firm predicts.

    Regionally, Greater China, North America and Western Europe are driving the use of connected things and the three regions together will represent 67% of the overall Internet of Things (IoT) installed base in 2017.

    The consumer segment is the largest user of connected things with 5.2 billion units in 2017, which represents 63% of the overall number of applications in use. Businesses are on pace to employ 3.1 billion connected things in 2017.

    “Aside from automotive systems, the applications that will be most in use by consumers will be smart TVs and digital set-top boxes, while smart electric meters and commercial security cameras will be most in use by businesses,” said Peter Middleton, research director at Gartner.

    In addition to smart meters, applications tailored to specific industry verticals — including manufacturing field devices, process sensors for electrical generating plants and real-time location devices for healthcare — will drive the use of connected things among businesses through 2017, with 1.6 billion units deployed.

    However, from 2018 onwards, cross-industry devices, such as those targeted at smart buildings — including LED lighting, HVAC and physical security systems — will take the lead as connectivity is driven into higher-volume, lower cost devices.

    In 2020, cross-industry devices will reach 4.4 billion units, while vertical-specific devices will amount to 3.2 billion units.

    While consumers purchase more devices, businesses spend more. In 2017, in terms of hardware spending, the use of connected things among businesses will drive $964 billion.

    Consumer applications will amount to $725 billion in 2017. By 2020, hardware spending from both segments will reach almost $3 trillion.

    Total IoT services spending (professional, consumer and connectivity services) is on pace to reach $273 billion in 2017.

  • Most cybercrime losses not fully recovered

    Most cybercrime losses not fully recovered

    Each year thousands of internet users fall victim to a cybercrime that leaves them out of pocket. Research from Kaspersky Lab reveals that over half (52%) of internet users who’ve lost money at the hands of cybercriminals have only got some, or none, of their stolen funds back.

    With the variety and sophistication of online financial threats against consumers growing, losses from online fraud, identity theft and hacking are now running at billions a year. And with many cases going unreported, the true economic cost is likely to be significantly higher.

    The research reveals how costly these attacks are for internet users, and how lucrative they’ve become for cybercriminals. On average, internet users lose $476 per attack and one-in-ten people surveyed said they lost more than $5,000.

    A large majority of internet users say they conduct financial operations online (81%) and just under half (44%) store financial data on their connected devices.

    As more users go online to manage their finances, more cybercriminals are looking for opportunities to cash in, making it important for users to have robust internet security in place to protect themselves and their money. Nevertheless, only 60% of internet users protect all their devices.

    Attitudes to online safety could be influenced by users mistakenly thinking lost money will be automatically refunded to them. Almost half (45%) say that they assume they will be reimbursed by banks for financial cybercrime without any problems, but as the survey shows, over half (52%) of people affected haven’t had all their stolen money returned.

    “Cybercriminals are continually looking for new ways to exploit and defraud consumers and that’s why it’s important for internet users to be on their guard at all times,” says Vyacheslav Zakorzhevsky, Head of the Anti-Malware Research Team at Kaspersky Lab.

    “Cybercriminals can conduct financial crimes via malware, phishing and more. Don’t assume you will always get all your money back if you become a target and funds are stolen from you. The best way to safeguard your finances online is to make sure you don’t become a victim, and for that we recommend specialist software that protects your identity and keeps sensitive data out of the hands of the cybercriminals.”

  • Half the world is now online

    Half the world is now online

    Internet penetration increased by 10% in the last 12 months to hit 3.773 billion, or 50% of the world’s population, according to a report from social media management platform Hootsuite and social media agency We Are Social.

    The report also showed that global social media use has increased by 21% in the last 12 months, reaching 2.8 billion users globally.

    Another finding is that mobile social media use has increased by 30% year-over-year to surpass 2.5 billion users globally, with 91% of social media users accessing social from mobile.

    In APAC, mobile data traffic leads significantly over other regions, with 4.12 billion gigabytes consumed, compared with 1.24 gigabytes from North Europe, Middle East, and Africa.

    Social media growth rates increased by over 50% year-on-year. More than 1.5 billion people across APAC now use social media on a monthly basis, 95% of whom access social via mobile devices – the highest ratio in the world.

    As a result, organizations in APAC should plan to transform their communications strategy to increase customer engagement and real-time interaction across the customer journey.

    “Half of the world’s population is now online, which is a testament to the speed with which digital connectivity is helping to improve people’s lives,” We Are Social’s Simon Kemp said.

    “Given this latest data, it’s probably time for us to stop referring to social as ‘new media’, and integrate it more seamlessly into our day-to-day activities.”

    The report compiles data from the world’s largest studies of online behavior, conducted by organizations including GlobalWebIndex, GSMA Intelligence, Statista, and Akamai.

  • Mobile contributed 6.2% to Bangladesh GDP in 2015

    Mobile contributed 6.2% to Bangladesh GDP in 2015

    Mobile technologies and services generated 6.2% of the GDP of Bangladesh in 2015, a contribution that amounted to around $13 billion of economic value, according to GSMA Intelligence.

    In the same year, mobile operators and the ecosystem provided employment to more than 760,000 people across Bangladesh, the report further stated. One-third of this was created directly in the ecosystem, while the rest is generated indirectly in other sectors as a result of the demand for production inputs generated by the mobile sector.

    “GSMA Intelligence findings clearly demonstrate the substantial contribution that mobile makes to the Bangladeshi economy,” GSMA head of spectrum Brett Tarnutzer said.

    “By systematically pursuing a policy framework that increases certainty, acknowledges market realities and removes regulatory barriers to investment and innovation, the Bangladeshi government and its citizens stand to achieve so much in the coming years.”

    In terms of public contribution, the mobile ecosystem generated about 10% of the government’s revenue in 2015, valued at $2.42 billion through general taxation, mobile-specific taxes, and spectrum licenses.

    Mobile’s overall impact includes the direct impact of the mobile ecosystem as well as the indirect impact and the increase in productivity brought about by the use of mobile technologies.

    GSMA added that Bangladesh performs close to the regional averages across metrics of mobile market development, despite a lower income than neighboring countries. Bangladesh is above the Asian average in terms of unique subscriber market penetration at 53%, while only slightly below with regard to mobile internet penetration at 33% and 3G at 20% of all mobile connections.

    Thus, it sees the potential for further growth if a supportive policy environment is put in place.

    GSMA Intelligence expects that the economic contribution of the mobile industry in Bangladesh will continue to increase. In value-added terms, it is estimated that the ecosystem will generate $17 billion by 2020. This forecast relies on a favorable macroeconomic environment and on a moderate expansion in demand and supply in the mobile market, as the number of mobile internet users and mobile coverage both increase.

    Employment opportunities are also set to expand from 780,000 jobs in 2016 to 850,000 jobs in 2020, an increase of around nine percent during that period.

    The amount of spectrum, and the terms on which it is made available, fundamentally drive the cost, range, and availability of mobile services. To ensure that this mobile vision becomes a reality, it is imperative that the spectrum is allocated in a way that encourages the rapid deployment of mobile broadband infrastructure, resulting in high quality, affordable mobile services for consumers across Bangladesh,” added Tarnutzer.

  • Is big data losing steam in Australia?

    Is big data losing steam in Australia?

    The Australian big data and analytics market is forecast to grow from $244.1 million in 2015 to $585.1 million in 2019, according to IDC.

    Banking, retail and government sectors have made impressive strides into the analytics domain with an objective of driving market and competitive intelligence.

    While the numbers look attractive, big data adoption levels are yet to reach those of cloud and mobility. There is plenty of data and good intentions, but talent shortage continues to be a challenge which needs to be addressed.

    The assertion that Australia has always been an early adopter of technology is challenged when it comes to big data and analytics. While a few standout organizations are investing to build sophisticated data-science algorithms, many others are yet to categorize big data from technology fad to business advantage.

    Regardless of shape, size, structure and format, big data’s contribution to competitive differentiation for Australian businesses cannot be disputed. Social media and high device penetration present an enticing set of newer and richer data sources.

    To deliver results, scaled out architectural capabilities will be key, along investments to develop the skillsets, platforms and processes that are necessary to keep in pace with the rate at which data is created.

    “Undoubtedly, big data presents an opportunity for retailers to leverage customer data and buying patterns to maximize revenues,” said IDC industry analyst Jaideep Thyagarajan.

    “While lack of data standardization has inhibited big data investments in healthcare, legacy modernization efforts have paid off for the public sector and investments are picking up,” said Thyagarajan. “This enables the government to operate at a higher potential, thereby enhancing service delivery to citizens.”

  • Two enterprise technology predictions for 2017

    Two enterprise technology predictions for 2017

    1. Retailers build competitive advantage through the Internet of Things

    With Hong Kong retailers still struggling in the face of falling tourist numbers, restricted spending from Mainland Chinese shoppers and fierce competition from e-commerce channels, I believe that bricks and mortar operations will focus on building competitive advantage through the Internet of Things (IoT) in 2017.

    Connected devices such as beacons and retail sensors are already helping some shopping mall operators to track footfall and visitor flow in order to determine optimal mall and store layouts, and to maximise rent yields.

    IoT technology also has the potential to enhance customer loyalty.  For customers that have opted in, there’s an opportunity for retailers to send personalised coupons or limited-time deals that bring more value to the traditional, in-store shopping experience.

    As more retailers explore the possibilities of IoT, consumers will no doubt take an interest in what personal data companies are accessing and how they plan to keep it safe. Already, there have been major news stories about security vulnerabilities in IoT devices.  Smart retailers will embed security protocols at the heart of their IoT services and processes to protect the data they harvest.

    As the need for IoT security emerges, businesses may also reconsider other cybersecurity vulnerabilities in terms of operations, finance and more. Many enterprises are not yet prepared for unexpected, malicious attacks, and might consider outsourcing cybersecurity management and adopting trusted cyber insurance solutions to stay one step ahead of the threats.

    2.  Blockchain drives financial service innovation

    In 2017, we can expect blockchain to firmly establish itself as a financial technology worth getting excited about, distinct from the hype – and the hitches – of bitcoin.

    Blockchain is a simple and elegant technology that can track the movement of money, authenticate transactions and validate ownership of financial assets. At its core, blockchain is a distributed database composed of blocks of transactional information, each one containing data about every transaction that came before, to form a chain. Fast and efficient, it’s also secure by design – a hacking event might affect one block, but the chain won’t be broken.

    In the coming year, I expect entrepreneurs – especially in the financial services industry – to look more closely at the type of businesses that can be built on blockchain.

    The Hong Kong Monetary Authority (HKMA) is already leading the way with its FinTech Supervisory Sandbox initiative, announced in September 2016. By promoting an experimental space with less regulation, the HKMA is opening up new possibilities for Hong Kong innovators to spearhead pioneering fintech services. Commercial centres in Asia and worldwide are already positioning themselves to be at the forefront of fintech, making 2017 an important year for Hong Kong to assert its own leadership in this space.

  • Mobile app usage growth shows signs of slowing

    Mobile app usage growth shows signs of slowing

    The mobile apps industry managed to achieve growth throughout last year, but signs suggest that usage growth is slowing down, according to Yahoo unit Flurry.

    Over the last year, the Flurry footprint grew to track more than 940,000 applications, across 2.1 billion devices, in 3.2 trillion sessions. In this context, app usage is defined as a user opening an app and recording what Flurry calls a “session”, as well as the amount of time spent in the application.

    Compared to the year prior, overall app usage grew by 11% and time-spent in apps grew by 69%. In previous years, all app categories had grown in tandem. However, this year the story is different.

    Mobile apps started eating their own, with session and time-spent growth in some app categories occurring at the expense of others. While Messaging and Social applications drove year-over-year session grow at 44%, the Personalization category gave up a staggering 46% in session usage. This steep decline in usage can be attributed to diminishing value for users of these products.

    In 2016, time spent in Social and Messaging apps grew by a strong 394% over the previous year, proving to be the driver that helped mobile achieve its year-over-year time-spent growth of 69%.

    This is a result of consumers using their social and messaging apps as their voice and video calling utilities, as well as the phenomenon Flurry calls Communitainment. With news and magazines sessions down 5% and Music, Media and Entertainment up only 1%, it’s safe to say that Social has absorbed the media industry.

    Business and Finance (up 43% in time-spent) and Sports (up 25% in time-spent) categories were immune to growth decay because they are intrinsically centered around mobile activities and rely on real time data.

    Gaming, the app category formerly known as “the darling of the mobile industry” saw time-spent decline by 4% year-over-year. Users are increasingly comfortable paying their way through games, with the mobile gaming industry seeing a strong increase in revenues according to Apple’s latest App Store report. Additionally, gaming remains a hit-driven industry.

    This year’s first “hit”, Pokémon Go, faded relatively fast, as consumers lost interest in the game, only returning for marquee holiday events. Another notable hit, Super Mario Run, was released too late in the year to make a difference for the overall engagement numbers.

  • Why omni-channel payments need to be the new norm in retail

    Why omni-channel payments need to be the new norm in retail

    Electronic payments account for 69%1 of consumer transactions in Singapore – just slightly higher than the global average of 65%. The country’s e-commerce market, valued at US$1.39b in 2015, is predicted to exceed S$7b in 2025 with 60% of consumers saying they bought products online at least once a month2 – some even showing a growing preference to shop online and pick up their purchases in-store.

    Consumer buying habits aren’t rooted solely at retail locations or online. They shift between retail stores at malls, smartphones, laptops, and transient, yet trendy, pop-ups. In other words, consumers are omni-channel shoppers. So why haven’t payment systems followed in the same direction?

    In Singapore, it’s a common sight to see retail counters with multiple terminals serving different modes of payment: one for credit cards, another for debit cards, yet another for contactless payments. On the back-end, business owners spend hours liaising with various vendors, different banks, grappling with multiple platforms and numerous devices.

    Businesses could instead integrate payments across multiple platforms – increasing efficiency and profits by adopting a seamless, omni-channel payments system. In doing so, they would be able to process payments with greater speed and efficiency saving time and resources in their back-offices, leverage integrated data for actionable insights, and offer customers a seamless, integrated experience.

    1. Greater efficiency
    70% of businesses surveyed in a KPMG report agreed that there are simply too many payment methods to deal with. Many retailers have multiple banking contracts and relationships across Singapore to manage, each of which provides part of the company’s in-store payment solution. This represents an enormous investment in managing reports and financial flows.

    By adopting omni-channel payments, businesses will be able to work across a single centralised platform that enables businesses to accept and process payments across multiple markets. In doing so, retailers can drastically simplify these processes, cut down on the human resource and financial investments needed to manage their payment acceptance.

    2. Leverage data for actionable insights
    The use of technology and data allows local retailers to gain business intelligence and insights into areas such as purchasing habits. Integrating payments from the point-of-sale (POS) system with accounting software or customer relationship management (CRM) systems to capture disparate pieces of information enables retailers to better serve their customers. Leveraging insights gleaned from payment information, retailers can decide when and who to offer discounts and deals to drive sales.

    Having access to cross-channel shopper data gives merchants a treasure trove of information that can be analysed for patterns online and offline. They can then mine this information for customer retention and loyalty marketing. Many merchants are already beginning to offer their customers an omni-channel shopping experience and in doing so significantly improve the shopper experience.

    An example: a shopper makes a number of purchases from an e-commerce site. Several months later, she goes shopping whilst on vacation. At the checkout, the terminal recognises the shopper’s card, and the staff member adds a discount and a personal thank you thus delighting the customer with an even more seamless, personalised experience.

    3. Seamless customer experience
    Businesses need to recognise that the customer journey today is fluid, accessible, and continuous. Shoppers can, and want, to purchase whatever they want, without restrictions on time, location, and across social, online, and mobile channels.

    Businesses too need to provide a seamless experience and allow customers to start a purchase in the channel of their choice and complete it in a potentially different channel of their choice.

    Here’s what a customer journey might look like: a shopper goes into a store and wants a shirt in a different colour than what’s currently available in-store. If a store has adopted an omni-channel approach, the shopper can go to the in-store tablet-assisted sales terminal that carries the entire web-based inventory, choose the colour they want, make the payment on the spot, and have it delivered to the address of their choice.

    Omni-channel payments enable retailers to service customers across multiple channels (in-store, online, or mobile); retail sectors, payment types (NETS or debit and credit cards), and payment methods (contactless, chip and PIN, magnetic and online) through mobile point-of-sales devices, payment gateway, or virtual terminal. In doing so, the store has gained a purchase rather than losing an opportunity.

    With discerning consumers becoming increasingly accustomed to omni-channel payment capabilities, it will transform “the next big trend” into “the new norm” for consumers in Singapore.

    1.https://newsroom.mastercard.com/asia-pacific/press-releases/singapore-among-top-markets-in-asiapacific-advancing-towards-a-cashless-society-new-mastercard-report/
    2.https://www.pwc.com/sg/en/publications/assets/total-retail-sea-2016.pdf
  • Affin Hwang Research retains Neutral on consumer sector

    Affin Hwang Capital Research is retaining its Neutral sector rating on the consumer sector and recommends stocks with solid track records and high yields, with Heineken as its top pick.

    It said on Monday while the Q3, 2016 earnings mainly disappointed,  it believes consumer spending will recover slowly in 2017 as the consumer sentiment index should pick up, backed by positive government initiatives.

    “Sector net profit fell by 26% YoY, with six of nine of our companies below expectations. We changed two ratings this round: we upgraded BAT to Hold on a share-price retraction which brought about more attractive dividend yields; and we downgraded MSM to Sell, as raw sugar prices have risen strongly, hurting margins.

    “We also recently upgraded Hai-O to Hold on better-than-expected growth in its multi-level marketing (MLM) division,” it said.

    Affin Hwang Research pointed out that while the Malaysian Institute for Economic Research (MIER) consumer sentiment remained low at 73.6 in 3Q16 – a slight pickup from an all-time low of 63.8 in 4Q15 since the global financial crisis – it was still below the 100-point threshold.

    According to Nielsen, Malaysian consumers are among the least confident in Asia Pacific. Given potentially higher transport costs and food prices partly due the removal of the cooking oil subsidy, it forecasts a higher full-year inflation rate of 2.7% in 2017 (vs. 2.2% in 2016E).

    Comparatively, MIER’s retail trade index improved to 111.6 in Q316, above the 100-point threshold, which seems to indicate that expected sales and business conditions will strengthen.

    Retail Group Malaysia forecasts 5% on-year growth in 2017 (vs 3% on-year  in 2016E and 1.4% on-year in 2015), expecting a boost on increased tourist arrivals. Budget 2017’s key initiative to increase government aid under the BR1M scheme by as much as 20% with an allocation of RM6.8bil and special assistance of RM500 to all public servants should also help boost consumer spending.

    “Nonetheless, the retail sector remains challenging, with earnings before interest and tax (EBIT) margins and same-store-sales growth in a downturn. The F&B segment will likely be hit by higher raw material prices moving forward.

    “While the tobacco segment lacks positive catalysts, BAT’s share price has come down and now offers dividend yields of 5% or more, on our estimates.

    “We are generally still positive on the brewery sector, which had done well in previous quarters, and we like our two stocks, Heineken and Carlsberg, for their dividend yields.

    “We expect domestic consumer spending to recover slowly in 2017, as consumer sentiment is expected to improve from its low base, supported by stable labor market conditions and a large young population. Maintain Neutral. We advise investors to focus on companies with defensive characteristics and attractive dividend yields,” said Affin Hwang Research.