Retail News CRM

Tag: Sales

  • South Korea’s Warehouse-style Pharmacies: Consumer Convenience Vs. Public Health Concerns

    South Korea’s Warehouse-style Pharmacies: Consumer Convenience Vs. Public Health Concerns

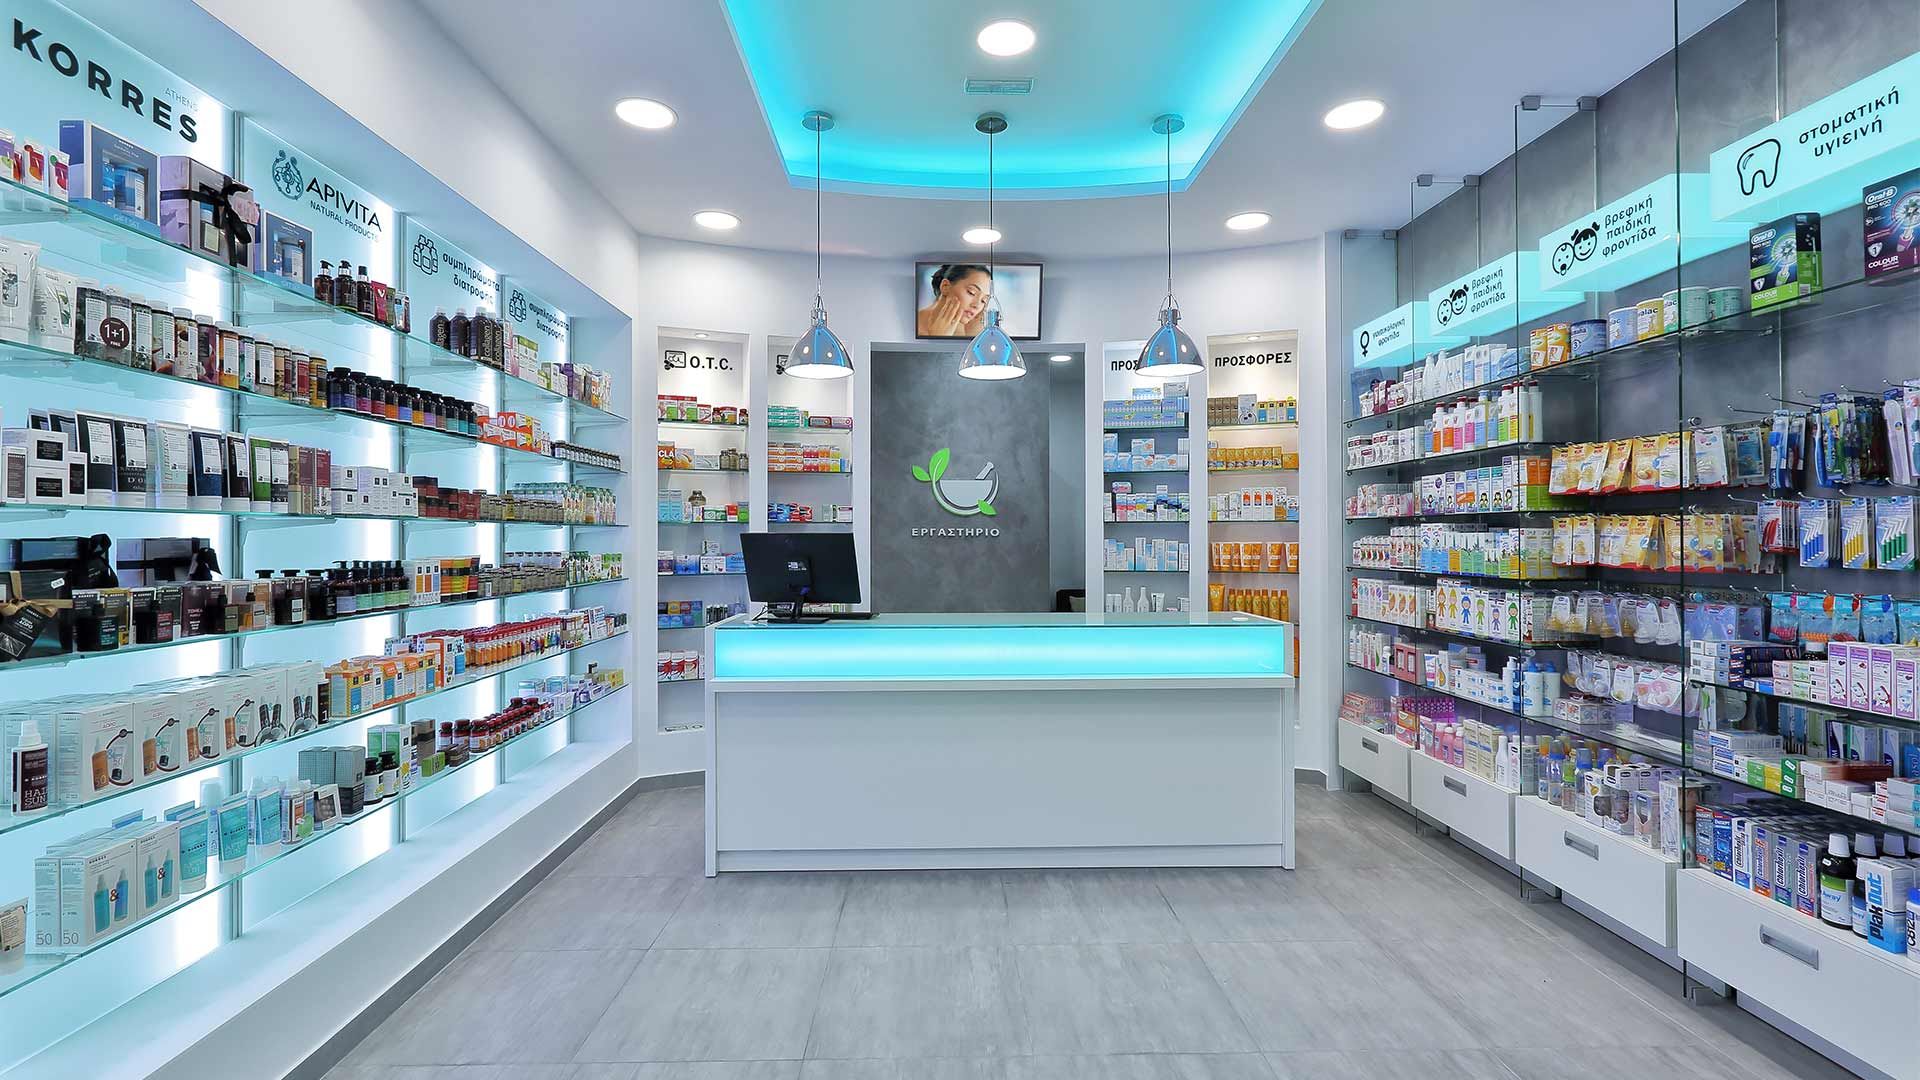
    South Korea is currently experiencing the rapid proliferation of large-scale ‘warehouse-style’ pharmacies, establishments that sell medications and wellness supplements in large quantities. This trend has sparked an intense discussion around public health and market equity.

    The Emergence of Warehouse-Style Pharmacies

    The trend of warehouse-style pharmacies was first noticed earlier this year in Seongnam, located to the south of Seoul. It has since spread to Gwangju, where two sizable pharmacies are preparing to commence operations this month. One of these pharmacies spans an area of 262 square meters, while another, yet to be launched, is expected to cover 760 square meters. Current registration guidelines allow these establishments to operate as long as they comply with legal requirements, thereby making it impossible for local governments to prevent their opening.

    Pharmacists’ Concerns

    Pharmacists’ associations have expressed serious concerns about this trend, warning about the potential risks it poses to patients and smaller community-owned pharmacies. The Gwangju Pharmaceutical Association, in particular, has issued a public statement urging a halt to the opening of new large-scale pharmacies. They emphasized that drugs are not mere consumer products but bioactive substances requiring extensive management and professional counseling.

    The Association further warned that if medicines are treated as commonplace household items in these large establishments, their misuse and abuse would inevitably increase. Such a scenario could also put more than 700 local pharmacies at risk of going under.

    Statistics support these concerns. The daily per-capita consumption of drugs in Korea has risen from 1123 in 2021 to 1432 in 2023. Over the past ten years, drug-associated fatalities have also risen by 1.7 times.

    Pharmacists also caution about the potential risks for patients with chronic illnesses who might face dangerous side effects from common analgesics or allergies caused by certain components without personalized guidance.

    Consumer Perspectives

    On the other hand, consumers see benefits in the new model. They are attracted to the cost competition and bulk display that promise more affordable medicines and increased convenience. Many shoppers, particularly those from Gwangju’s Seo district, appreciate the opportunity to have a wider variety of vitamins and supplements available under one roof.

    This debate mirrors previous conflicts around the sale of basic over-the-counter drugs at convenience stores in 2012, and the more recent surge in online sales of supplements.

    Local governments have admitted their inability to limit these openings under the current laws but have committed to rigorous monitoring. They underscored their commitment to prioritizing citizen safety by closely inspecting facilities, staffing, and adherence to regulations while working in tandem with local pharmacist groups.

    This ongoing debate underscores the growing friction between the consumer’s need for convenience and affordability and the health sector’s concerns regarding safety and societal costs.

    Questions & Answers

    What is the concern of local pharmacists about the trend of warehouse-style pharmacies?
    Local pharmacists express concern about the potential risks it may pose to both the smaller community pharmacies and patients. They worry that treating medicines as common consumer goods could lead to their misuse and abuse, jeopardizing public health.

    How has the daily per-capita consumption of drugs changed in Korea from 2021 to 2023?
    The daily per-capita consumption of drugs in Korea has increased from 1123 in 2021 to 1432 in 2023, according to the statistics.

    What is the stance of local governments on the proliferation of warehouse-style pharmacies?
    While local governments currently cannot restrict the opening of these establishments, they have pledged to maintain rigorous monitoring efforts. They aim to prioritize citizen safety by closely inspecting facilities, staffing, and regulatory compliance.
  • Puma’s Data-driven Approach Boosts Customer Loyalty In Southeast Asia

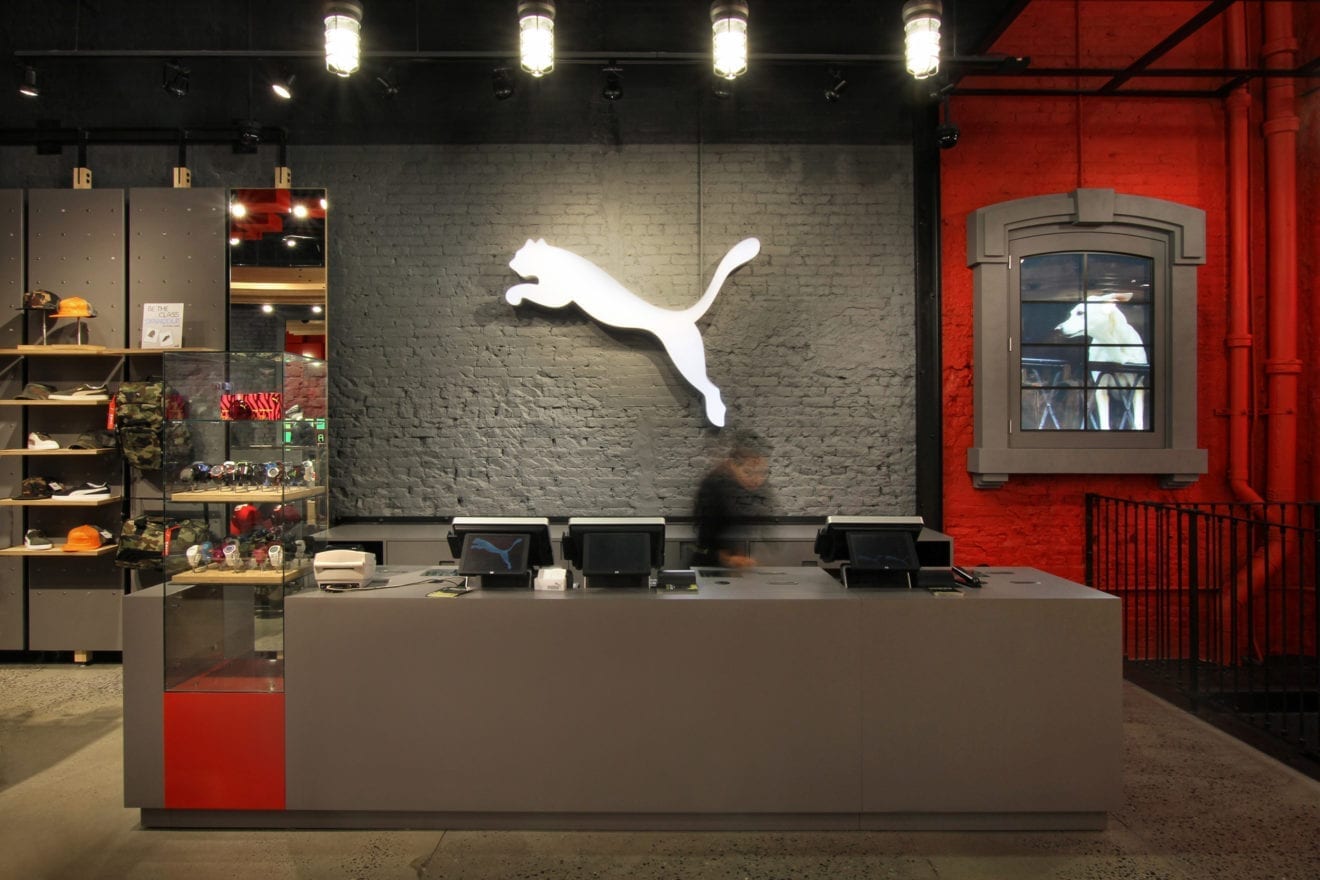
    Puma’s Data-driven Approach Boosts Customer Loyalty In Southeast Asia

    In the retail and branding sector, data reigns supreme. It provides valuable insights that can be employed to boost personalisation and foster customer loyalty. Sportswear retailer Puma provides a case study for this, as it navigates customer relationship management (CRM) and lifecycle marketing in Southeast Asia.

    Understanding the Data Challenge

    A one-size-fits-all CRM strategy won’t suffice, especially in Southeast Asia’s diverse market. The key to any successful CRM strategy is the development of a robust database. Ankit Madhogaria, Puma’s director of e-commerce Southeast Asia, emphasizes the importance of gathering accurate consumer data both online and in physical stores. This data can then be integrated into software platforms to provide a comprehensive view of all customer interactions, transactions, and touchpoints.

    However, Puma has experienced difficulty in procuring data from its offline customers, with Madhogaria noting that customers are less inclined to share information unless they are given a compelling reason to do so. The data required can be categorized into three types: communication data (like phone numbers or emails), personal data (such as birthdays or purchase anniversaries), and behavioral data, which includes the channels customers use to make purchases. Madhogaria suggests that capturing these data types can present robust opportunities for future campaign creation and customer engagement.

    The Power of Personalisation

    Puma has been redefining personalisation at scale with the assistance of SAP Emarsys’ customer engagement platform. The platform has enabled Puma to execute smart lifecycle strategies customized to suit each market within the region, resulting in impactful omnichannel engagement.

    Madhogaria believes that successful personalisation is achievable with the right tools and an effective data capturing strategy. Using these tools, Puma can generate product recommendations that can be integrated into emails, thus driving increased click-through and conversion rates.

    Successful Campaigns and Strategies

    Madhogaria highlighted several successful campaigns driven by their data-driven approach. Puma has implemented cross-sell promotions in transaction-related emails, which generally have a higher open rate. For instance, if a customer purchased running shoes, Puma recommended complementary items such as a t-shirt or shorts. This strategy resulted in a 3% increase in returning customers within a month, translating to a near 20% rise in efficiency and a substantial boost in revenue.

    Puma’s Birthday Bash campaign was another major success, particularly in Southeast Asia. The campaign, celebrating Puma’s birthday with significant discounts, resulted in a nearly 60% uplift in offline revenue and nearly triple the online revenue. Notably, almost 60% of the campaign’s revenue came from repeat customers.

    Building Loyalty in Southeast Asia

    Understanding the nuances of different markets and consumers’ preferred communication channels is crucial for building loyalty. For instance, Viber is significant in the Philippines, Line in Thailand, and Zalo in Vietnam.

    Madhogaria stresses the importance of continuous experimentation to understand what strategies work best in each market. Puma’s approach demonstrates that successful CRM in Southeast Asia involves more than just data collection; it requires testing, learning, and delivering campaigns that resonate with local consumers.

    Questions & Answers

    What are the three types of data Puma gathers from customers?
    Puma gathers three types of data: communication data (like phone numbers or emails), personal data (such as birthdays or purchase anniversaries), and behavioral data, which includes the channels customers use to make purchases.

    How has Puma personalized its marketing strategy?
    Puma uses SAP Emarsys’ customer engagement platform to implement personalized lifecycle strategies tailored to each market. The tool also generates product recommendations that can be integrated into emails to customers.

    What successful campaigns have Puma executed in their CRM journey?
    Puma has executed several successful campaigns, including the Birthday Bash campaign that resulted in a nearly 60% uplift in offline revenue and nearly triple the online revenue. Another strategy involved integrating cross-sell promotions into transaction-related emails, which led to a 3% increase in returning customers within a month.

  • Fast Retailing Marks Historic Milestone: First Japanese Retailer To Hit 1 Trillion Yen In Domestic Sales

    Fast Retailing Marks Historic Milestone: First Japanese Retailer To Hit 1 Trillion Yen In Domestic Sales

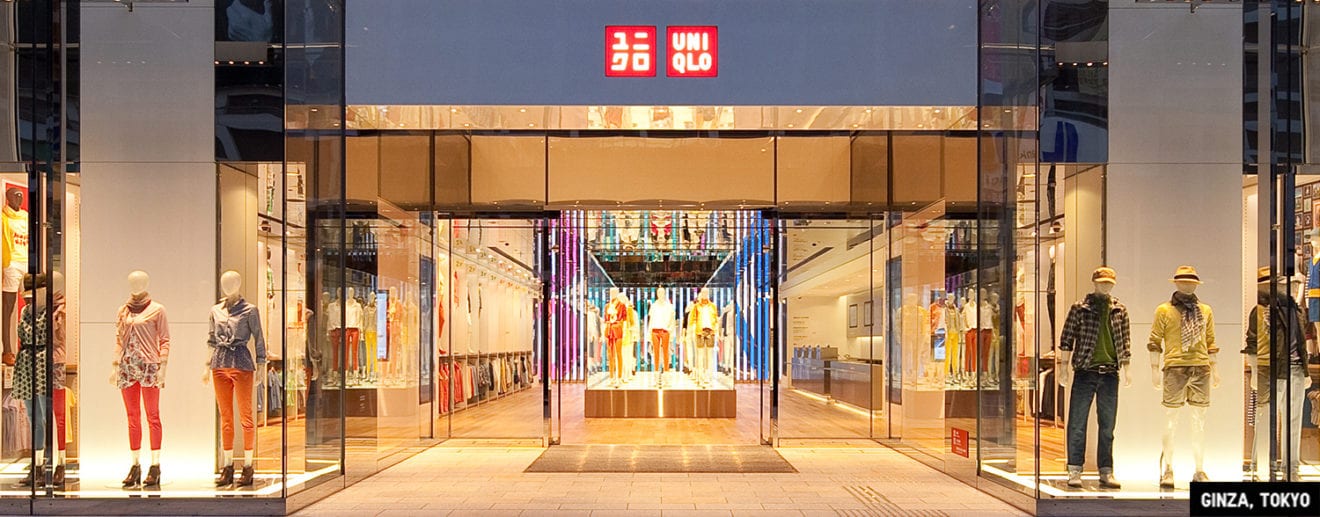
    Fast Retailing, the parent company of Uniqlo, has made history as the first Japanese clothing company to achieve domestic sales of 1 trillion yen. In the fiscal year ending in August, Uniqlo’s domestic sales increased by 10% to approximately 1.03 trillion yen, equivalent to $6.98 billion. By the end of August, Uniqlo had 784 stores in Japan, the first of which opened its doors in Hiroshima 41 years ago. These impressive domestic sales figures encompass revenue from physical stores, online sales from the brand’s e-commerce site, and 10 franchise locations.

    Fast Retailing’s sales have seen a marked uptick since the fiscal year of 2022, thanks to a series of store and product overhauls. Over the past five years, the company has shuttered 30 stores across Japan. At the same time, the average sales floor space per store has been expanded by 10%, allowing for a broader product display and stirring up customer demand. This strategy resulted in a 13% rise in average sales per store.

    Innovative Business Approach

    Among the company’s operational triumphs was the launch of the ‘Management Cockpit’ platform. This platform gathers product reviews from the online store and customer feedback from the support center. This data is then leveraged to enhance existing products, create new merchandise, and generate demand forecasts.

    The introduction of the platform has allowed Fast Retailing to swiftly manufacture in-demand products, consequently reducing the time from production to sale. Additionally, the platform helps to prevent an oversupply of items by cutting production of those with low demand.

    Future Projections

    Looking at the broader picture, Fast Retailing’s consolidated sales revenue is projected to grow by 10% to 3.4 trillion yen by fiscal year 2025. Net profit is also expected to rise by 10%, setting a new record at 410 billion yen.

    Currently, Fast Retailing holds the third position in the global apparel industry in terms of sales, trailing behind H&M in second place and Inditex, the parent company of Zara, in the top spot.

    Questions & Answers

    What sales milestone has Fast Retailing recently achieved?
    Fast Retailing has become the first clothing company in Japan to reach 1 trillion yen in domestic sales.

    What strategies has Fast Retailing used to boost their sales?
    Fast Retailing has increased the average sales floor space in their stores by 10% and introduced the ‘Management Cockpit’ platform to gather data and improve their product offering.

    What are Fast Retailing’s projections for future sales and profits?
    Fast Retailing anticipates its consolidated sales revenue will grow by 10% to 3.4 trillion yen in FY25, with a net profit increase of 10% to a record 410 billion yen.

  • Metcash Reports 5.1% Sales Increase Amidst Tobacco Sales Slump And Upcoming Marketing Campaign

    Metcash Reports 5.1% Sales Increase Amidst Tobacco Sales Slump And Upcoming Marketing Campaign

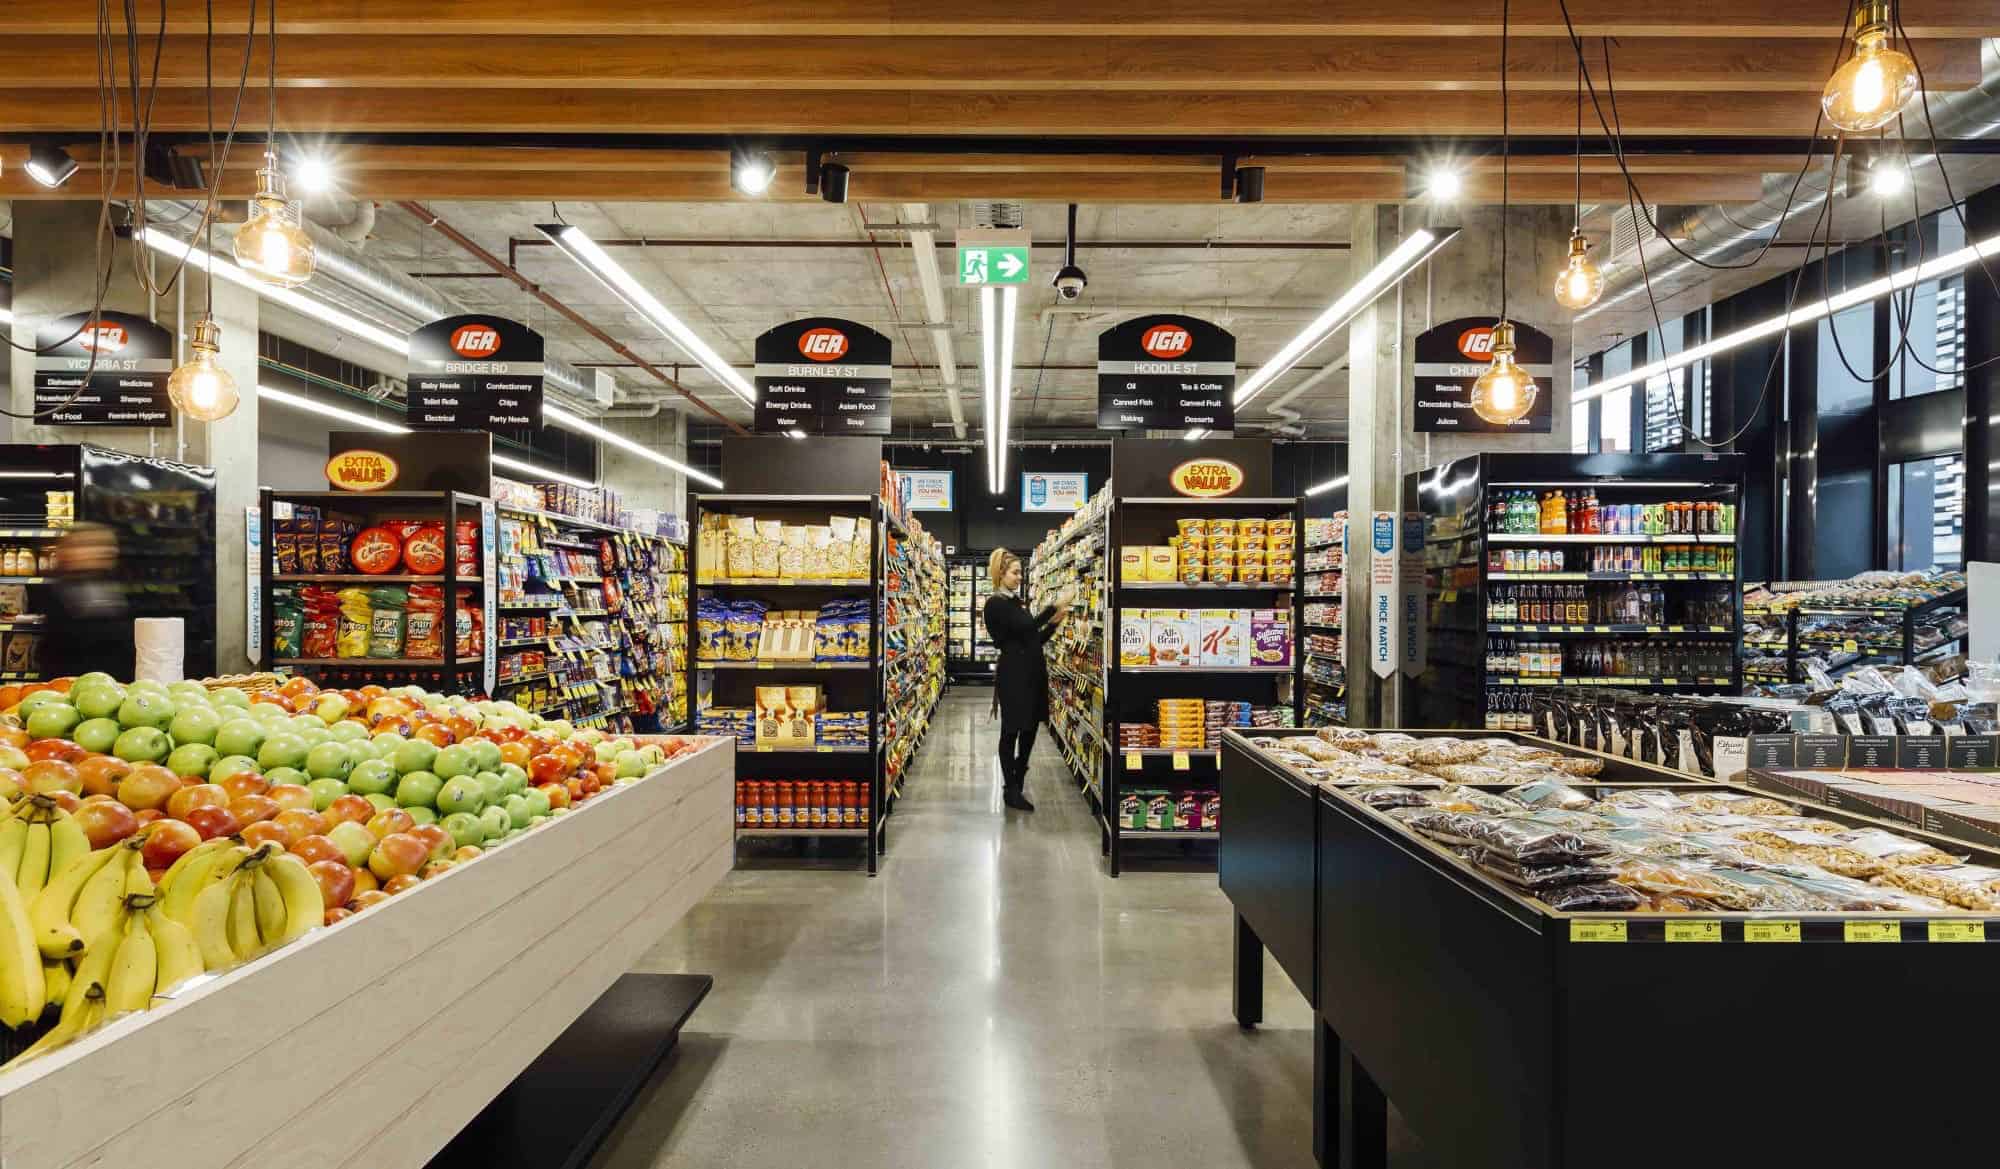
    Metcash, a prominent retail conglomerate, reported a notable 5.1% increase in group sales (excluding tobacco) for the 18 weeks leading up to August 31st this year. This growth coincides with the company’s plans to launch its first-ever cross-pillar marketing campaign, which is scheduled to impact over 3,000 bannered stores in the upcoming quarter.

    Uptick in Food Sales

    Metcash’s food division experienced an 8.6% growth in sales, with supermarket sales contributing to this increase with a 2.6% rise. This is largely owing to the company’s strategic focus on differentiated and localized offerings to consumers. However, the supermarket sector witnessed a significant slump in tobacco sales, with a larger than expected decrease of 32.1%. This drop is reflective of the company’s active efforts to diversify away from tobacco products.

    Convenience and Foodservice Sector Performance

    The convenience and foodservice division also demonstrated robust performance, with a sales surge of 29.5%. Within this sector, Campbells and Convenience reported a sales growth of 14.6%, while Superior Foods noted a 2.7% increase in sales.

    Liquor and Hardware Sales

    Metcash’s liquor division registered a modest growth of 1.5%, despite facing heightened competitive pressures and an influx of promotional activities from rivals. Concurrently, the company is nearing the conclusion of its acquisition process for Steve’s Liquor Warehouse Group.

    Meanwhile, the hardware department (IHG) reported a 2.2% sales growth, driven predominantly by the trade sector. Notably, builder’s hardware, building supplies, timber panels, and doors were the standout performers within this sector.

    Total Tools, however, only saw a minor 0.5% increase in sales, attributed to subdued trade activity and cost-of-living challenges. Nevertheless, the company’s network sales did witness a 3% growth.

    Questions & Answers

    **Why did Metcash’s supermarket segment experience a decline in tobacco sales?**
    The decline in tobacco sales is a result of Metcash’s strategic move to transition away from tobacco products due to increasing health consciousness among consumers.

    **What factors contributed to the growth of Metcash’s food division?**
    The growth in the food division can be attributed to Metcash’s focus on differentiated and localized offerings, which resonated with consumers’ preferences.

    **Why did Total Tools see only a marginal increase in sales despite the growth in Metcash’s hardware sales?**
    The marginal growth in Total Tools sales was due to subdued trade activity and cost-of-living challenges which impacted consumer spending. However, its network sales still managed to grow by 3%.

  • Singapore’s Retail Sector Sees Robust Growth In July, Led By Tech Industry

    Singapore’s Retail Sector Sees Robust Growth In July, Led By Tech Industry

    In July, the retail sector in Singapore displayed promising growth, with most categories reporting an uptick in sales.

    July’s Retail Sales Growth

    Singapore’s retail industry experienced an impressive 4.1% increase in July, a significant improvement over June’s modest 0.5% rise, when motor vehicle sales are excluded from the total. The total estimated retail sales value for the month was SG$3.6 billion (US$2.8 billion), with online sales accounting for 15.5% of this figure.

    On a seasonally adjusted basis, July’s retail sales figures represented a 3.8% increase from the previous month.

    Industries Contributing to Retail Growth

    The majority of industries within the retail trade sector contributed to July’s growth. The most substantial improvement was observed in the computer and telecommunications equipment industry, which reported a year-on-year increase in sales of 11.1%.

    Sales in the watches and jewellery sector, as well as supermarkets and hypermarkets, rose by 9.6%. Department stores, cosmetics, recreational goods, along with optical goods and books, also experienced sales uplifts, ranging between 4.1% and 8.6%.

    However, not all industries enjoyed a rise in sales. Food and alcohol, apparel and footwear, and petrol service stations saw declines in sales of between 2% and 5.6%.

    Growth in Food and Beverage Services

    The food and beverage services sector also registered growth in July. This sector saw a rise of 1.7% in sales, an improvement over the flat growth reported in June. The total sales value of F&B services was approximately SG$1 billion, with online sales representing 25.9% of this figure.

    Questions & Answers

    Which retail sector experienced the most substantial growth in July?
    The computer and telecommunications equipment industry reported the most significant growth, with sales up 11.1% year-on-year.

    Did all retail sectors in Singapore experience growth in July?
    No, the food and alcohol, apparel and footwear, and petrol service stations sectors saw a decline in sales.

    How did the food and beverage services sector perform in July?
    The food and beverage services sector saw a 1.7% rise in sales, compared to flat growth in June. Online sales made up 25.9% of the total sales in this sector.

  • Hong Kong’s Retail Sales Rise For Third Consecutive Month Amid Increased Tourism

    Hong Kong’s Retail Sales Rise For Third Consecutive Month Amid Increased Tourism

    July’s retail sales in Hong Kong experienced an upward trend, marking the third consecutive month of positive growth. Sales figures showed a 1.8% year-on-year increase, achieving a total value of HK$29.7 billion ($3.8 billion). This increase followed a more modest growth of 0.7% in June.

    Sales Volume Increases

    In addition to this financial upturn, retail sales volume also saw a rise of 1% in July compared to the previous year. This is a significant improvement from the 0.3% decrease experienced in June. However, a broader look at the year reveals that retail sales decreased in value by 2.6% and in volume by 4% over the first seven months of 2025 compared to the same period in 2024.

    A government representative expressed optimism about these figures, suggesting that consumer sentiment is expected to remain consistent. Furthermore, this spokesperson highlighted the positive impact of government initiatives that encourage tourism and large-scale events, all of which are predicted to provide benefits to retail businesses.

    Tourist Arrivals Boost Retail

    Data from the Hong Kong Tourism Board showed an increase in visitor arrivals during July. A total of 4.39 million visitors marked a 12% increase from the same month the previous year. This is a noticeable acceleration compared to the 3.48 million in June, 4.08 million in May, and 3.85 million in April.

    Of these visitors, 3.51 million originated from mainland China, an 11.8% increase in comparison to the previous year. Despite the increasing number of visitors, spending habits indicate a more conservative approach with many choosing to limit their overall expenditure.

    Specific Sector Performance

    Particular sectors within the retail industry showcased robust growth. Jewellery, watches, clocks, and valuable gifts saw sales surge by 9.4% year-on-year in July, up from a rise of 6.9% in June. The clothing, footwear, and allied products segment, however, saw a marginal growth of 0.1%, a slight recovery from a 4.6% drop in June.

    Questions & Answers

    How much did Hong Kong’s retail sales increase in July?
    Sales rose by 1.8% year-on-year, achieving a total value of HK$29.7 billion ($3.8 billion).

    What was the growth in the number of visitors from mainland China?
    The number of visitors from mainland China increased by 11.8% compared to the previous year, reaching a total of 3.51 million in July.

    Which retail sector saw the most significant growth?
    The sector of jewellery, watches, clocks, and valuable gifts saw the most substantial growth with a 9.4% year-on-year rise in sales in July.

  • Berjaya Food Reports Rising Losses: Starbucks Malaysia’s Struggles Amid Middle East Conflict

    Berjaya Food Reports Rising Losses: Starbucks Malaysia’s Struggles Amid Middle East Conflict

    Berjaya Food, a Malaysia-based company, has recently reported a significant increase in losses and a decrease in sales for both their fourth quarter and the entire fiscal year. Berjaya Food, which operates Starbucks Coffee in Malaysia and Brunei, along with Kenny Rogers Roasters and Paris Baguette in Malaysia, experienced reduced sales due to a decrease in store numbers.

    Quarterly Report

    The revenue for the group, for the quarter ending on June 30, experienced a decrease of 11 per cent compared to the previous year, settling at RM115.8 million (US$27.4 million). This reduction is mainly attributable to the decrease in the number of store locations. However, the management has noted a slight increase in sales compared to the third quarter. This increment is primarily due to an improved sales performance from Starbucks Malaysia.

    In this quarter, the loss before tax increased from RM42.6 million to RM183.7 million. The primary reason for this increase was the impairment of property, plant, and equipment (PPE) and right-of-use (ROU) assets linked to non-performing stores.

    Annual Report

    For the entire fiscal year, the revenue dropped by 36 per cent, amounting to RM476.7 million. This drop is linked to the ongoing sentiment surrounding the Middle East conflict, which has affected market dynamics and altered customers’ purchasing behaviours.

    The pre-tax loss for the year broadened from RM89 million to RM288.7 million. This loss was due to the necessary impairment provision to PPE and ROU assets, resulting from the downsizing of Starbucks Malaysia’s operations.

    Questions & Answers

    What were the main reasons for the loss in Berjaya Food’s fourth quarter and fiscal year?
    The primary reasons were the impairment of property, plant, and equipment (PPE) and right-of-use (ROU) assets of non-performing stores, and also the downsizing of Starbucks Malaysia’s operations.

    Did Berjaya Food see any improvement in the fourth quarter compared to the third quarter?
    Yes, sales were slightly higher in the fourth quarter compared to the third, primarily due to improved sales performance at Starbucks Malaysia.

    How did the Middle East conflict affect Berjaya Food’s annual results?
    The ongoing conflict in the Middle East has influenced customers’ spending patterns and affected market dynamics, which contributed to the significant drop in the annual revenue.

  • Giordano Sees Sales Surge Amid Economic Uncertainty: E-commerce Success And ‘beyond Boundaries’ Strategy Key

    Giordano Sees Sales Surge Amid Economic Uncertainty: E-commerce Success And ‘beyond Boundaries’ Strategy Key

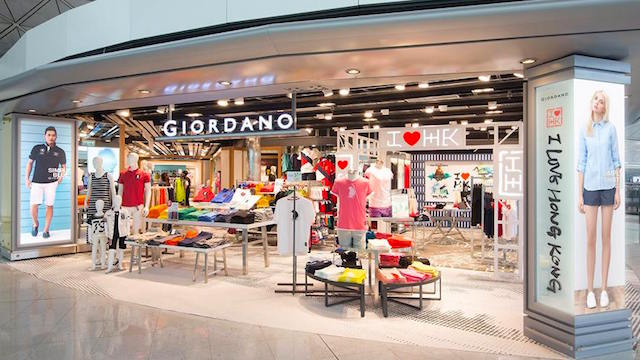
    Hong Kong’s prominent fashion retailer, Giordano, recently announced an increase in their sales for the first half of the fiscal year. This significant improvement in sales is mainly attributed to a substantial surge in the company’s e-commerce operations.

    Positive Revenue Growth Amid Economic Uncertainty

    Giordano’s revenue for the first half of the fiscal year experienced an increase of 1.6 per cent, amounting to HK$1.934 billion (US$248 million). The management team highlighted this growth as a significant accomplishment in the midst of a fluctuating political and economic environment.

    The primary contributor to this growth was the company’s online business, which saw a remarkable increase of 26.1 per cent. This surge was credited to ongoing digital transformation efforts and customer-centric strategies.

    Geographical Revenue Analysis

    In the realm of geographical revenue, Mainland China saw a 13 per cent increase, with a nearly 18 per cent rise in the second quarter and an 8 per cent surge in the first quarter. Same-store sales remained steady in Q2, which was a positive shift from the 3.6 per cent decline in Q1.

    Revenue in Hong Kong and Macau reversed from a 6.5 per cent drop in Q1 to a 2.2 per cent increase in Q2, outperforming the overall negative retail sales in Hong Kong’s clothing sector.

    Sales in the Gulf Cooperation Council similarly experienced a 1.9 per cent growth during the half. However, Southeast Asia and Australia witnessed an 8 per cent decrease, mainly due to the poor performance in the Indonesian market.

    The company’s gross margin dropped by 3.3 percentage points to 55.6 per cent, which was primarily due to a larger volume of online sales and wholesale, inventory clearance efforts, and increased merchandise costs. The attributable net profit remained fairly consistent, with a minor increase of 0.8 per cent to HK$121 million.

    The ‘Beyond Boundaries’ Strategy

    CEO Colin Currie shed light on the company’s ‘Beyond Boundaries’ five-year strategy, which was initiated a year ago. He said that through this strategy, they were able to successfully execute a series of ‘Quick Win’ initiatives to establish a robust foundation for 2025 and beyond.

    The central focus of the ‘Beyond Boundaries’ strategy for 2025 is to strengthen the ‘Digital-First’ approach, simplify the brand portfolio, and make significant strides in Greater China.

    Currie stated that while the company is pleased with the positive results, they are continually reviewing and adjusting areas that need improvement, particularly in safeguarding their gross margin. To support better performance, they are actively improving their processes and enhancing sourcing efficiency.

    Last year, Giordano reported a 1.2 per cent revenue increase.

    Questions & Answers

    What led to the increase in Giordano’s sales for the first half of the fiscal year?
    The increase in sales was primarily driven by a significant boost in the company’s e-commerce operations.

    How did Giordano’s geographical revenue perform during this period?
    Mainland China experienced a 13 per cent revenue increase, while Hong Kong and Macau saw a 2.2 per cent rise. However, Southeast Asia and Australia faced an 8 per cent decrease in revenue.

    What is Giordano’s ‘Beyond Boundaries’ strategy?
    The ‘Beyond Boundaries’ strategy is a five-year plan aimed at strengthening the ‘Digital-First’ approach, simplifying the brand portfolio, and making significant strides in Greater China.

  • Lego Reports Record Revenues In 2025: Strong Global Demand, Innovative Products, And Sustainability Efforts Drive Growth

    Lego Reports Record Revenues In 2025: Strong Global Demand, Innovative Products, And Sustainability Efforts Drive Growth

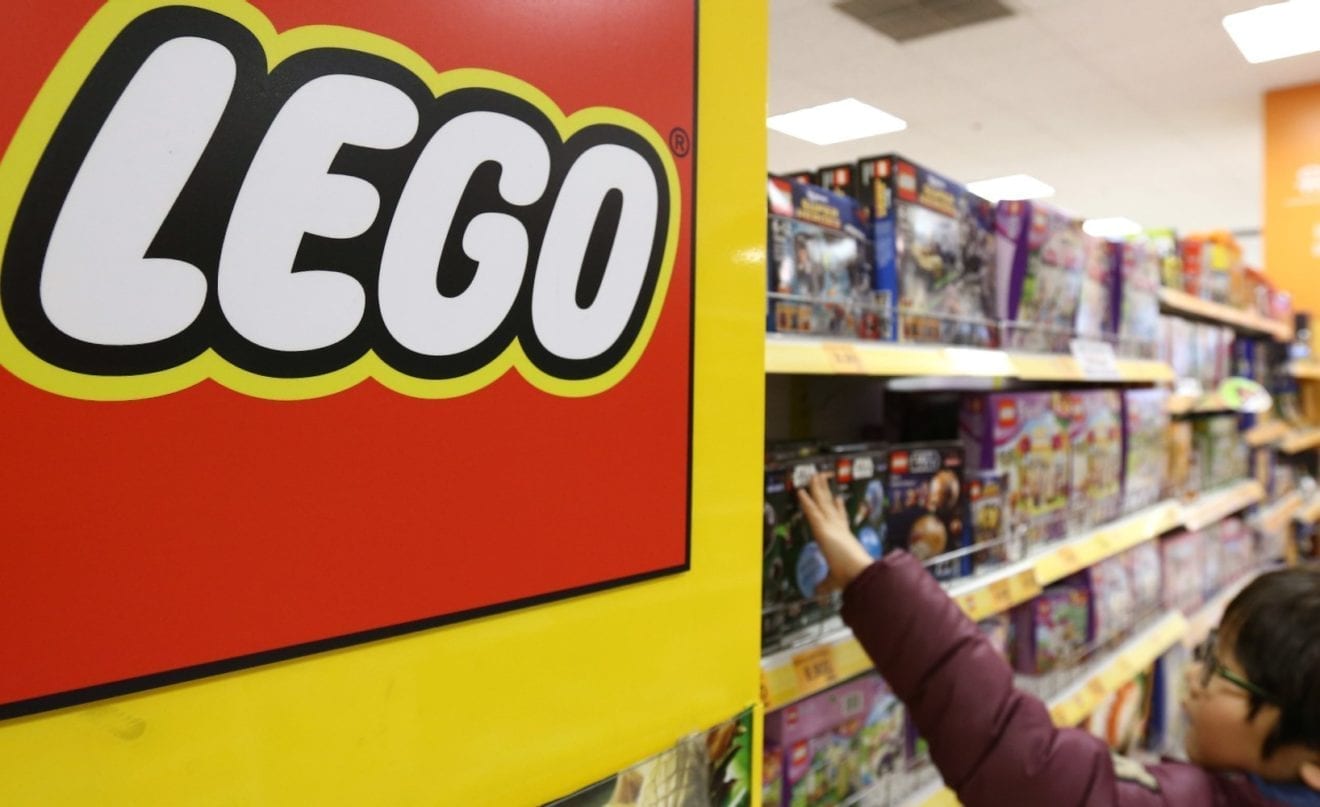
    The Lego Group marked the commencement of 2025 with a significant increase in revenue and profit, buoyed by worldwide demand, strategic partnerships, and the introduction of new products.

    The company’s financial results reveal a 12% annual increase in revenue, reaching a total of US$5.3 billion. Concurrently, net profit experienced a 10% boost, amounting to $1.01 billion. The operating profit mirrored this trend with a 10% rise, culminating at $1.4 billion. These figures reflect the company’s impressive performance, outstripping the global toy market’s estimated growth of 7% over the same timeframe.

    Driving Forces of Growth

    CEO Niels B Christiansen attributes the company’s upward trajectory to its vast and innovative product range, which retains relevance across various age groups and interests. He also emphasized the company’s solid financial foundation built over several years, underpinning its continued investment in capacity growth and strategic initiatives.

    Consumer sales saw approximately a 13% increase, propelled by bestselling items. These bestsellers encompass a combination of original and licensed themes, such as Lego City, Lego Technic, Lego Botanicals, Lego Icons and Lego Star Wars. The group is also looking forward to launching a collaboration with Pokémon in the coming year.

    Lego set a new record within the first half of its 2025 fiscal year by releasing 314 new sets. This achievement underscores its focus on product innovation and its intent to broaden its appeal to diverse age groups and interests.

    Global Expansion and Sustainability Efforts

    The company’s growth is largely credited to robust consumer demand, particularly in the United States and various regions of Europe, the Middle East, and Africa. Lego further bolstered its global presence by opening 24 new stores, including its inaugural store in New Delhi. This expansion brings its total store count to 1079 across 54 markets.

    Despite the challenges posed by inflation and global trade tensions, Lego managed to maintain stable supply chains through its manufacturing network spread across Denmark, Mexico, Hungary, China, and Vietnam. The construction of a new factory in Virginia is progressing as planned, with operations expected to commence in 2027.

    On the sustainability front, Lego reported a considerable increase in its use of materials from sustainable sources. The company is on track to achieve its 2025 goal of sourcing 60% of materials from sustainable sources, with 53% sourced from mass balance materials and 7% sourced from segregated content.

    Christiansen reasserted the company’s commitment to inspiring and nurturing children worldwide, which includes ensuring a healthy planet for future generations. He noted the company’s strong position to invest significantly in sustainable growth both presently and in the future.

    Questions & Answers

    What are some of the key factors contributing to Lego’s growth?
    The company attributes its growth to its wide and innovative product range, strong global demand, particularly in the U.S. and parts of Europe, the Middle East, and Africa, and its continued investment in capacity expansions and strategic initiatives.

    How is Lego responding to inflation and global trade tensions?
    Through its extensive manufacturing network in Denmark, Mexico, Hungary, China, and Vietnam, Lego has managed to maintain stable supply chains despite these challenges.

    What is Lego’s stance on sustainability?
    Lego has significantly increased its use of materials from sustainable sources and aims to source 60% of its materials from such sources by 2025. The company remains committed to ensuring future generations inherit a healthy planet.

  • Tim Hortons China Sees Q2 Recovery, Cites New Strategy And Franchise Growth As Key Drivers

    Tim Hortons China Sees Q2 Recovery, Cites New Strategy And Franchise Growth As Key Drivers

    TH International Limited, the company responsible for operating Tim Hortons coffee shops in China, has reported a slight recovery in the second quarter. This recovery has helped to counterbalance the economic strain resulting from store closures and decreased revenue from company-operated outlets.

    Financial Performance

    The system sales experienced a 1.4 percent increase since last year, reaching a total of $57.2 million. Despite this growth, total revenues decreased by 4.9 percent, amounting to $48.7 million. However, the company recorded a positive adjusted EBITDA of $300,000 and a reduced adjusted net loss of 16.2 percent, which amounts to $5.5 million.

    The company’s CEO, Yongchen Lu, stated the company’s “Coffee + Freshly Prepared Food” strategy as the driving force behind the improved results. New product offerings led to an increase in food revenue by 8.6 percent from last year. Consequently, the contribution of food revenue to system sales rose to a record 35.2 percent.

    Albert Li, the CFO, pointed out the efficiency enhancements in the company’s operations. The costs of food, packaging, and labor dropped as a percentage of store revenues. He attributed the improved financial performance to the refinement of store unit economics and operational efficiencies at both store and corporate levels.

    Growth and Challenges

    During the quarter, the company introduced 40 made-to-order stores while discontinuing 49 non-made-to-order outlets, mainly smaller Tim Hortons Express units. Despite this, the contribution from company-operated stores dropped to $3.8 million, a decrease from the previous year. This decrease can be attributed to store consolidation and declining same-store sales.

    Franchising proved to be a successful venture. Revenues from franchised stores increased by 50.7 percent, reaching $9.4 million. The franchise network expanded from 333 to 449 locations. In addition, other revenues, including sub-franchise and retail businesses, more than doubled compared to last year.

    Despite a net loss of $10.6 million, the management remains optimistic. They believe the operational enhancements and an improved food mix put the company in a position for steady growth.

    Questions & Answers

    What was the company’s strategy that drove its stronger results?
    The company employed a “Coffee + Freshly Prepared Food” strategy that particularly improved results through new product offerings.

    How did the company improve its financial performance?
    The company refined store unit economics and enhanced operational efficiencies at both the store and corporate levels.

    What changes occurred in the company’s franchising operations?
    There was a revenue increase of 50.7 percent from franchised stores. The franchise network also expanded to 449 locations from 333 in the previous year.

  • Dolce & Gabbana Reports 4% Revenue Growth Despite Retail Challenges; Sets High Ambition For Beauty Division

    Dolce & Gabbana Reports 4% Revenue Growth Despite Retail Challenges; Sets High Ambition For Beauty Division

    Dolce & Gabbana, the revered Italian luxury fashion brand, has unveiled financial figures for the fiscal year that came to a close on March 31. The company saw its revenue climb by 4 per cent, translating to a total of US$2.2 billion.

    Revenue Drivers and Losses

    The primary catalyst behind this revenue growth was an 11 per cent surge in wholesale sales, accounting for 46 per cent of the brand’s total revenue. Unfortunately, the company also witnessed a 3 per cent decline in retail sales, indicative of challenges in crucial markets such as Europe and Asia.

    Despite the increase in revenue, Dolce & Gabbana’s net loss expanded to $136 million from the previous fiscal year’s figure of $15 million.

    Department Specific Performance

    Notably, the fashion and home division of the company experienced an 8 per cent revenue drop to $1.4 billion. This downturn is attributable to weakened demand in Europe and China, with the effect partially mitigated by gains in the Middle East, South America, and South Africa.

    On the other hand, the beauty segment posted strong figures, with sales escalating by 30 per cent year-over-year to approximately $699 million.

    Expansion and Future Endeavors

    From 2022 onwards, Dolce & Gabbana has broadened its makeup offerings to encompass more than 100 products. The brand plans to further expand this range to a complete line of 350 SKUs and has recently launched a skincare line, the Fresh Skin Collection.

    In terms of future goals, the company has set its sight on achieving $1.1 billion in annual beauty sales by the end of fiscal 2027. This objective emerges as part of their strategic shift from licensing to direct management of the beauty division.

    Additionally, Dolce & Gabbana has obtained $116 million in medium-term financing and has extended the maturity of a $345 million term loan to 2030.

    Questions & Answers

    What was the primary driver behind Dolce & Gabbana’s revenue growth?
    The primary driver was an 11 per cent increase in wholesale sales, which now account for 46 per cent of the brand’s total revenue.

    How did Dolce & Gabbana’s beauty segment perform in the past fiscal year?
    The beauty segment performed exceptionally well, with sales seeing a 30 per cent year-over-year increase to approximately $699 million.

    What are Dolce & Gabbana’s future plans for their beauty division?
    The company plans to achieve $1.1 billion in annual beauty sales by the end of fiscal 2027, following its strategic shift from licensing to direct management of the beauty division.

  • Lovisa Reports Record Sales And Profit Growth Amid Accelerated Global Expansion

    Lovisa Reports Record Sales And Profit Growth Amid Accelerated Global Expansion

    Lovisa, the popular jewelry chain, reported significant growth in its sales and profit in the past fiscal year, alongside an accelerated expansion program.

    Revenue and Sales Growth

    Lovisa’s revenue for the fiscal year, ending June 29, experienced a 14.2% surge, reaching A$798.1 million. This increase was primarily due to the persistent expansion of the store network. During the year, Lovisa launched 162 new stores, wrapping up the year with a total of 1,031 stores across over 50 markets. A noteworthy milestone was the opening of its first store in Zambia and the establishment of three new franchise markets in Ivory Coast, the Republic of Congo, and Panama.

    Comparable store sales also saw a growth of 1.7%, showing a marked improvement in the second half of the year, following a relatively stagnant first half.

    Profit Increase

    Lovisa also reported a significant rise in its earnings and net profit. Earnings before interest tax saw a hike of 8.2%, reaching $138.7 million while the net profit after tax rose by 4.8%, amounting to $86.3 million.

    Lovisa’s global CEO, John Cheston, remarked on the company’s consistent performance, highlighting its impressive gross margin performance and the acceleration of store rollouts in the second half of the fiscal year. Cheston expressed his eagerness to continue prioritizing affordable, high-quality fashion jewelry.

    Outlook for the New Fiscal Year

    In the initial eight weeks of the new fiscal year, Lovisa reported a 28% total sales increase and a 5.6% rise in comparable sales, along with the addition of 10 new stores. The company intends to keep expanding both its physical and digital store networks, with strategic plans to foster growth in both existing and new markets.

    Questions & Answers

    What contributed to Lovisa’s significant growth in the past fiscal year?
    Lovisa’s growth was primarily driven by the continued expansion of its store network, with 162 new stores opened during the year.

    What were the earnings and net profit for Lovisa in the last fiscal year?
    The earnings before interest tax rose 8.2% to $138.7 million and the net profit after tax increased by 4.8% to $86.3 million.

    What are Lovisa’s plans for the new fiscal year?
    Lovisa plans to continue expanding its physical and digital store networks, with strategies in place to drive growth in existing and new markets.

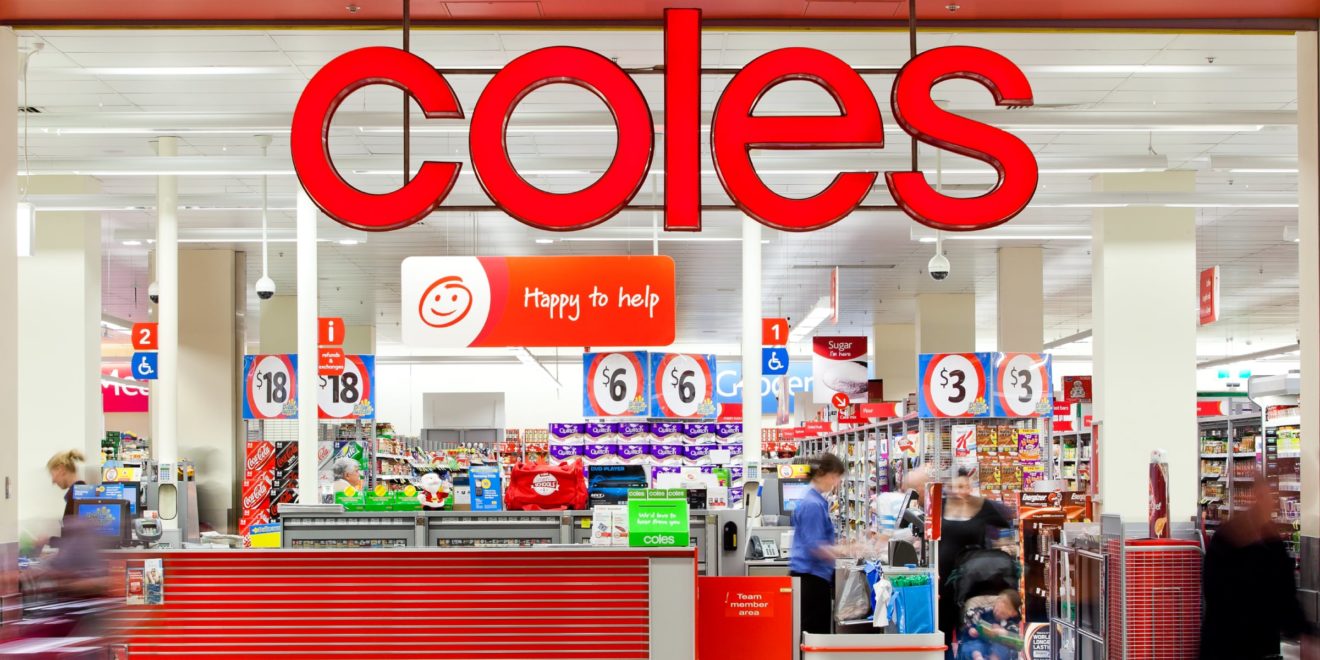
  • Coles Reports Robust Fiscal Year Results: Supermarket Sales Surge, E-commerce Thrives, Liquor Division Shows Moderate Growth

    Coles Reports Robust Fiscal Year Results: Supermarket Sales Surge, E-commerce Thrives, Liquor Division Shows Moderate Growth

    Coles has announced a 3.6% increase in group sales, reaching $44.3 billion, with an EBITDA rise of 11% to $3.9 billion for the current fiscal year. The group’s net profit after tax also increased, up by 2.4%, yielding a total of $1.07 billion.

    Driving Growth Through Supermarkets

    The company attributes much of its sales growth to its supermarket division, which showed a robust performance, growing by 4.3% and reaching $40 billion. The supermarket division’s EBITDA also rose by 9%, jumping from $2 billion to $2.1 billion. In addition, the division saw a rise in gross margin, from 26.6% to 27.4% on a year-on-year basis.

    This increase in supermarket sales revenue was bolstered by strong volume growth across transactions and basket sizes. Customers reacted positively to the company’s seasonal ‘Great Value, Hands Down’ value campaigns. Notably, the company had strong performance across several special occasions, such as Christmas, Easter, Halloween, and Mother’s Day. The success of collectible and continuity programs, such as the Curtis Stone Glassware and Harry Potter Magical Discs campaigns, played a significant role in bolstering Coles’ supermarket results for this financial year.

    Evolving E-commerce Performance

    Coles’ e-commerce sector within the supermarket division witnessed a rise of 24.4%, reaching $4.5 billion. The increase in penetration to 11.2% was driven by digital campaigns, Black Friday, Coles Fest, and the May Mega Sale.

    However, the group’s liquor division reported a slight increase of 1.1% in sales revenue, amounting to $3.6 billion, with a flat gross margin at 23.5%. The division’s EBITDA saw a decrease of 8.6%, falling from $133 million to $113 million on a year-on-year basis. Despite the decrease, Coles saw positive results in the liquor sales due to new store openings, a Tasmanian acquisition, and the curating of its wine category to meet local customer preferences.

    Liquorland and Future Plans

    Coles’ simplified ‘Simply Liquorland’ banner pilot was well-received in selected stores across South Australia, Victoria, and Queensland. The company plans to complete the ‘Simply Liquorland’ by the third quarter of the next fiscal year at a one-time cost of approximately $20 million. In addition, they plan to open about 19 new liquor stores, close 25 stores, and renew roughly 130 stores.

    Looking forward, Coles’ Chief Executive Officer, Leah Weckert, emphasized that the primary focus for the company will be on cost control and the delivery of the first full year of annualised benefits from its ADC program.

    Questions & Answers

    What drove the growth in Coles’ sales?
    The growth in Coles’ sales was largely driven by a strong performance in its supermarket division and positive customer response to its seasonal value campaigns.

    How did Coles’ e-commerce sector perform?
    Coles’ e-commerce sector within the supermarket division showed a significant rise of 24.4%, reaching $4.5 billion.

    What are the future plans for Coles’ ‘Simply Liquorland’?
    The ‘Simply Liquorland’ is planned to be completed by the third quarter of the next fiscal year, with approximately 19 new liquor stores being opened, 25 stores getting closed, and about 130 stores being renewed.

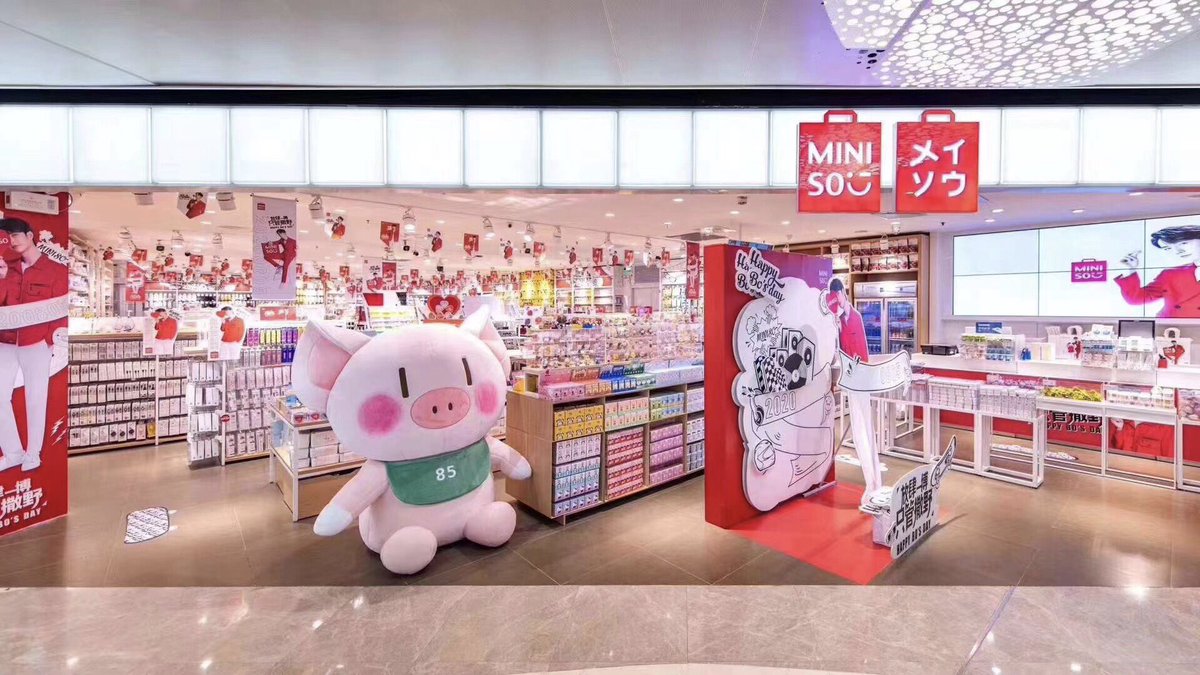
  • Miniso’s sales soar 23 per cent in second quarter, but profit shrinks

    Miniso’s sales soar 23 per cent in second quarter, but profit shrinks

    The retail conglomerate, Miniso, posted a decrease in profits despite its sales increasing by a double-digit percentage in the second quarter.

    Revenue Growth

    Miniso’s revenue for the quarter ending June 30th saw a massive increase of 23.1%, amounting to approximately USD 693.2 million. The retailer has various brands under its umbrella, including Miniso and Top Toy. Miniso’s revenue witnessed a rise of 19.5%, amounting to USD 637 million. This growth included a 13.6% increase in Mainland China and a 28.6% growth in international markets. Top Toy’s revenue surged by 87% to USD 56.1 million.

    Same-Store Gross Merchandise Value

    The same-store gross merchandise value (GMV) of Miniso remained steady, backed by a small growth in mainland China and a slight decline in international markets. However, Top Toy’s same-store GMV registered minor growth.

    Strategic Financing

    Miniso highlighted that Top Toy had finalized strategic financing by Temasek recently, resulting in a post-valuation of approximately USD 1.28 billion.

    Operating Income and Profit

    Although the operating income rose by 11.3% to USD 116.7 million, the profits fell from USD 82.4 million in the same period last year to USD 68.3 million.

    For the first half of the year, revenue grew by 21% to USD 1.3 billion. This rise included an 18% increase in Miniso sales and a 73% rise in Top Toy sales. However, the profit for the same period dropped from USD 163 million to USD 126.5 million.

    Store Expansion

    As of June 30th, the total number of stores at the group level was 7,905, representing a year-on-year increase of 842 new stores. Miniso had 7,612 stores, which included 4,305 in Mainland China and 3,307 in international locations, while Top Toy had 293 outlets.

    The company anticipates that its revenue growth will speed up for the rest of the year.

    Questions & Answers

    How much did Miniso’s revenue increase in the second quarter?

    Miniso’s revenue for the second quarter increased by 23.1%, amounting to approximately USD 693.2 million.

    How did Miniso’s operating income and profit perform in the second quarter?

    The operating income rose by 11.3% to USD 116.7 million, but the profit fell from USD 82.4 million in the same period last year to USD 68.3 million.

    What is the total number of Miniso stores as of June 30th?

    As of June 30th, Miniso had a total of 7,612 stores, which included 4,305 in Mainland China and 3,307 in international locations.

  • The A2 Milk Company Reports Robust Financial Growth Amid Challenges; Declares First Dividends

    The A2 Milk Company Reports Robust Financial Growth Amid Challenges; Declares First Dividends

    The A2 Milk Company has reported a significant increase in its revenue for the current financial year. The group’s revenue rose by 13.5 per cent, reaching $1.9 billion, a notable increase from last year’s $1.67 billion.

    Financial Growth and Profit

    This upward trend can also be seen in the company’s EBITDA, which increased by 17.1 per cent to $274.3 million. Furthermore, the company’s net profit after tax saw an impressive boost of 21.1 per cent, reaching $202.9 million.

    In China, a key market for the company, revenue grew by 18.9 per cent, totalling $1.3 billion. The company’s EBITDA also saw substantial growth, increasing by 14.6 per cent to $332.4 million. This growth has solidified the company’s position as a top-four brand in China’s infant formula market.

    Segment Performance

    The A2 Milk Company’s infant formula business reported a 10 per cent growth overall, largely propelled by its English label business that saw an increase of 17 per cent.

    However, the company’s Australia and New Zealand (ANZ) segment experienced a slight dip, with revenue declining by 0.4 per cent to $316 million. The ANZ segment’s EBITDA also fell, decreasing by 8.7 per cent to $57.5 million.

    In contrast to the ANZ segment, the company saw significant growth in the US, with revenue increasing by 22.5 per cent to $139.3 million. Despite this, the company did report losses in its EBITDA, though these were reduced to $9.3 million, down from the previous financial year’s $15.5 million.

    Company Milestones and Acquisitions

    “I’m proud of what our team has achieved this year, reporting record sales of $1.9 billion and double-digit earnings growth in our 25th year since The A2 Milk Company was formed,” said CEO David Bortolussi.

    The company has achieved a significant milestone this year, declaring its first-ever dividends with a 71 per cent payout ratio. This marks a significant moment for the company’s shareholders.

    In addition, the company has acquired Yashili New Zealand’s fully integrated nutritional manufacturing facility located in Pokeno, New Zealand. The facility comes with two existing China Label product registrations. Bortolussi described the acquisition as a pivotal moment for the company and a crucial part of their supply chain transformation strategy.

    Future Outlook

    Looking ahead, the company expects single-digit revenue growth in the next financial year. The company also anticipates an EBIDTA margin between 15 and 16 per cent and a similar net profit after tax as the current financial year.

    Questions & Answers

    What was the percentage increase in the company’s group revenue?
    The A2 Milk Company’s group revenue increased by 13.5 per cent.

    What was the growth rate of the company’s infant formula business?
    The company’s infant formula business saw a growth rate of 10 per cent.

    What does the company expect for the next financial year?
    In the next financial year, the company anticipates single-digit revenue growth, an EBITDA margin between 15 and 16 per cent, and a similar net profit after tax as the current financial year.